Why International and Why Now

International stocks have soared this year as talk about the end of U.S. exceptionalism, the end of dollar dominance, the end of globalization and other seemingly sudden shocks have impacted the markets. Yet, the trend of international developed market outperformance began much earlier than these trendy topics began circulating and is more deeply rooted.
Changing tide
A new cycle is well underway with new characteristics. Market watchers tend to define market cycles by bull markets—starting on the date of the market low after a 20% decline (a bear market) has been recovered. The current bull market began in mid-October 2022. Since then, international stocks have been outperforming U.S. stocks, the opposite of what had taken place over the cycle that began following the Great Financial Crisis. The outperformance has been dramatic. European stocks, making up more than half of global developed markets outside the United States and tracked by the MSCI EMU Index, have outpaced the S&P 500 Index by more than 35 percentage points, measured by total return in U.S. dollars. This has been off the radar of many investors who have been instead focused on the performance of the U.S.'s "Magnificent 7" growth stocks. Leadership outside the U.S. has shifted to value sectors like financials and industrials, marking a shift from the prior cycle lead by growth stocks.
European stocks outperform U.S. since current bull market began
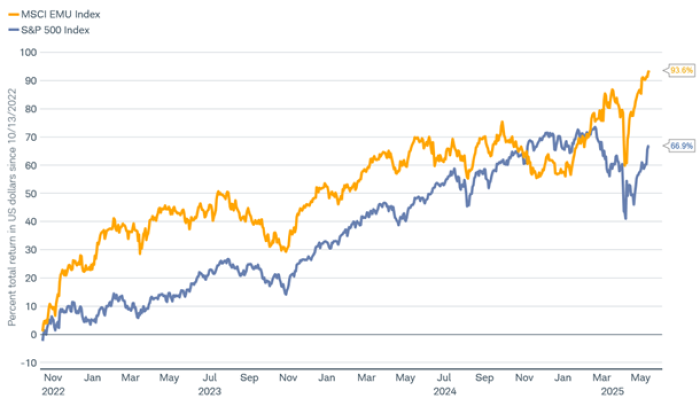
Source: Charles Schwab, MSCI, Bloomberg data as of 5/15/2025.
Indexes are unmanaged, do not incur management fees, costs and expenses, and cannot be invested in directly. Past performance is no guarantee of future results.
Shark attack
It isn't just European stocks, but international stocks overall have also outperformed U.S. stocks since the bull market began in October 2022, measured by the MSCI EAFE Index and the MSCI USA Index, respectively. We have been using the shark chart below for a long time to talk about cycles in investing and the danger posed when the trend changes and the jaws begin to bite down. Historically, at the start of each cycle the lines have changed direction; the leader becomes the laggard. The leaders of the last cycle tend to reverse and fall the most in the bear market while the recovery and next cycle tend to see new leaders. When the orange line is rising, U.S. stocks are outperforming, as they did in the 1990s and 2010s. When the blue line is rising international stocks are outperforming, as they did in the 1980s and 2000s. It reverses for each cycle, although the degree of outperformance differs. The reasons are as behavioral as much as they are fundamental, after a full cycle of outperformance, trends revert.
Jaws closing again?
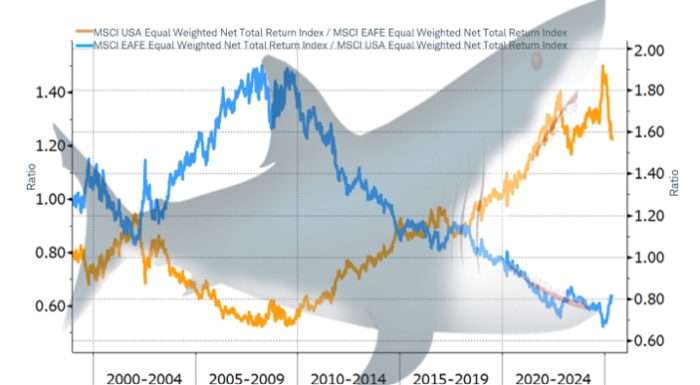
Source: Charles Schwab, Bloomberg data as of 5/15/2025.
Past performance is no guarantee of future results.
Many investors seem to focus on trying to determine the near-term winners and losers from recent U.S. tariffs, but they could be missing the longer-term shift in leadership that is already well underway. A major shark attack could take a big bite out of unprepared investors' portfolios. Those who haven't engaged for some time in trimming what had been outperforming and buying what had been lagging could be especially at risk since these market cycles tend to last years, not months, with the new leadership continuing until the next cycle.
The coming wave
Even after two and a half years of international outperformance, it isn't too late to rebalance from the U.S. to international stocks with weightings in line with a long-term strategic asset allocation. In fact, doing so now may still be ahead of the many investors that simply follow the trend.
Not surprisingly, investors tend to follow performance trends. But what may be surprising is which performance trend they follow. Money flows by investors in exchange-traded funds (ETFs) and mutual funds tend to follow the three-year relative performance momentum of U.S. and international stocks. When the three-year rolling return favors the U.S., flows tend to follow, and vice versa. With the three-year anniversary of the current bull market favoring international stocks nearing this fall, investors may soon begin to shift more of their money into international stocks.
Go with the flow
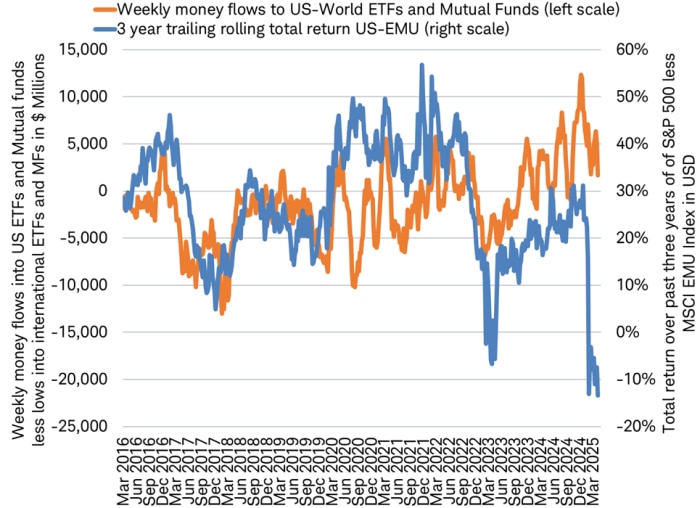
Source: Charles Schwab, Investment Company Institute, Bloomberg data as of 5/15/2025.
Indexes are unmanaged, do not incur management fees, costs and expenses, and cannot be invested in directly. Past performance is no guarantee of future results.
Not too late
Fortunately, it isn't too late to make such a shift. These cycles tend to last many years, typically until valuations become extended. International stocks are fairly valued compared to historical data, especially relative to U.S. stocks. In fact, the forward price-to-earnings ratio for international, European and emerging market stocks are close to their long-term averages, while the valuations of US stocks remain well above average, as you can see in the chart below.
Non-U.S. stock market valuations are close to long-term averages
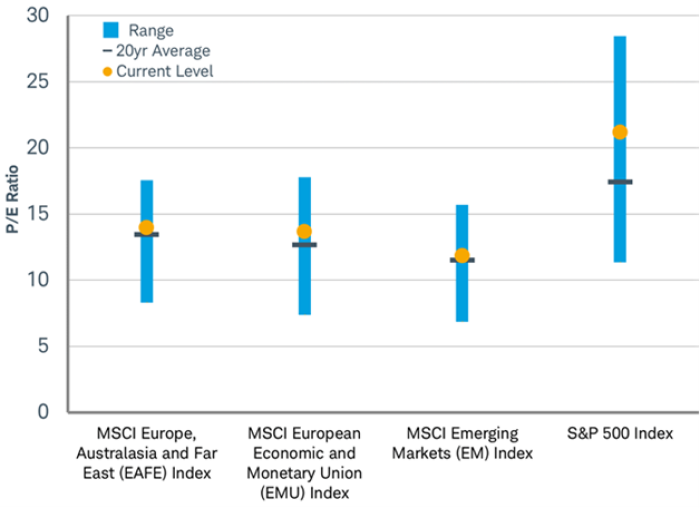
Source: Charles Schwab, MSCI, Bloomberg Estimates as of 5/16/2025.
P/E Ratio is the ratio of market price and the forward (or next twelve months) earnings estimates. Indexes are unmanaged, do not incur management fees, costs and expenses, and cannot be invested in directly. Past performance is no guarantee of future results.
How much "tech" do you own?
Canada's stock market has outperformed the U.S. this year as the two countries have been locked in a battle over tariffs. But is this the whole story? What best explains the relative performance of the U.S. versus other stock markets over time? Politics? Economic growth? Inflation? Currency? All of these can matter, but history shows the main factor influencing performance is sector exposure.
Canada's biggest stock market sector is Financials at 37% of the index, including big names like TD Bank and Royal Bank of Canada. This compares to 14% exposure in the U.S. stock market. The relative performance of the U.S. and Canadian stock markets tracks the relative performance of the world's Tech and Financial sectors, as you can see in the chart below.
U.S. vs. Canada = Tech vs. Financials
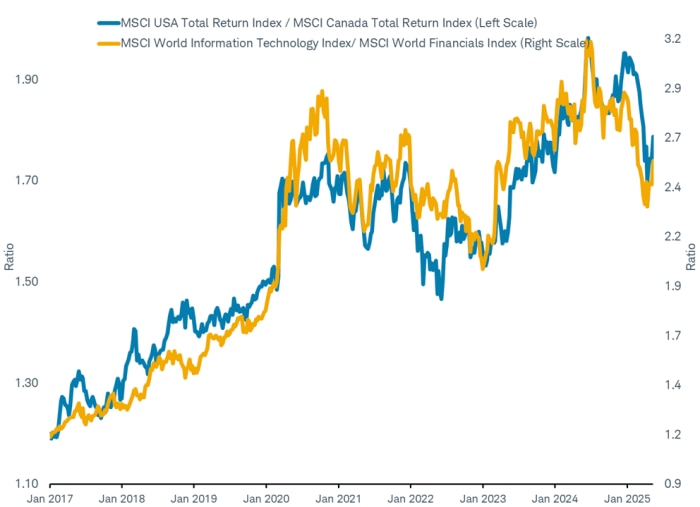
Source: Charles Schwab, Bloomberg data as of 5/16/2025.
Indexes are unmanaged, do not incur management fees, costs and expenses, and cannot be invested in directly. Past performance is no guarantee of future results.
The point is that despite politics and other macro factors, it is sector performance that is the primary driver of markets' relative performance. The U.S. stock market (S&P 500) has tended to perform in line with the Tech sector (MSCI World Technology Index), as you can see in the chart below. The correlation, defined as the interdependence of variables, measured statistically between their performance is a very high 0.92 on both a monthly and weekly basis over the past 10 years, and on a daily basis over the past two years. That isn't a perfect relationship, but a very strong one.
S&P 500 and World Tech sector

Source: Charles Schwab, Bloomberg data as of 5/16/2025.
Indexes are unmanaged, do not incur management fees, costs and expenses, and cannot be invested in directly. Past performance is no guarantee of future results.
If U.S. stocks behave like the world's Tech sector and Canada like the Financials sector, what sectors align with the performance of other countries' stock markets? Australia tends to behave like Materials, France like Industrials, Germany like Autos, and the United Kingdom like the Energy sector, as examples. It may be worth reviewing how much Tech-like exposure investors may have in their portfolios if they are concentrated in the U.S., rather than being more globally diversified. Perhaps instead of concentration in a few other countries that also behave just like one sector, broad diversification may be preferable.
Over the past 10 years, the U.S. has had different political parties in office, different rates of economic growth and inflation, Federal Reserve rate cuts and hikes, yet the "U.S. exceptionalism" that has driven the relative outperformance by U.S. stocks appears to have been primarily the result of Tech exposure. The U.S. will likely remain connected with Tech in the future as it has historically, but Tech stocks don't always lead the stock market. For example, Tech was the best performing sector in the 1990s, then it was the worst for the 2000s. Investors may want to consider some diversification away from a heavy concentration in any one market sector.
Home bias
When investors talk about "the stock market" they are most often referring to an index that tracks stocks only in their home country. This home bias is evident when it comes to the makeup of investors' stock portfolios. Investors around the world tend to hold mostly domestic stocks. U.S. investors, for example, tend to put about 75% of their equity holdings in domestic stocks, much higher than the U.S. share of the global equity market. Those American investors with holdings based solely in the U.S. are missing out on about half the world's investable universe. Investors in very few countries have less than 50% of their portfolios invested in stocks outside their home country.
Home bias: Investors' portfolios overweight their home country no matter where they live
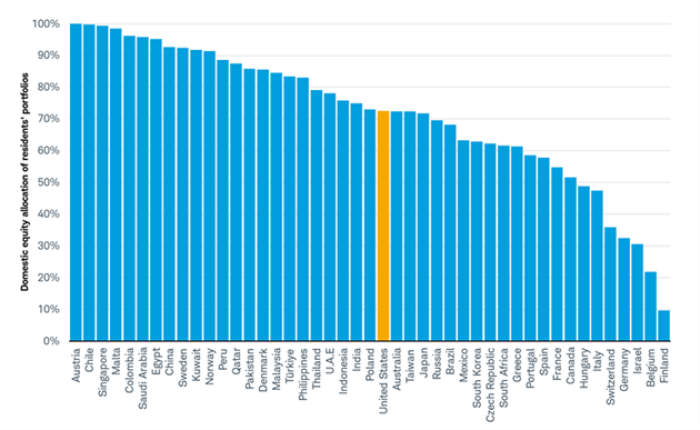
Source: Charles Schwab, IMF PIP data, MSCI index data retrieved 5/16/2025.
Investors with a large home bias may not be nearly as diversified across sectors as they believe and risk missing their financial goals as longer-term trends tend to shift with the start of a new global economic cycle. A broad international mutual fund or ETF is one way to obtain exposure to a lot of sectors and stocks, rather than having to research and select individual securities for a portfolio. Fortunately, as many investors around the world consider reducing their home bias, obtaining global diversification has never been easier or less expensive.
How much exposure outside your home country should you have in your portfolio? That depends on your risk tolerance and time horizon. It is clear from the data that most investors can broaden their opportunity set and diversify their portfolios by simply boosting the international portion of their stock portfolios. Now may be a good time to consider rebalancing portfolios back toward international stocks.
Heather O'Leary, Senior Global Investment Research Analyst, contributed to this report.