Looking to the Futures
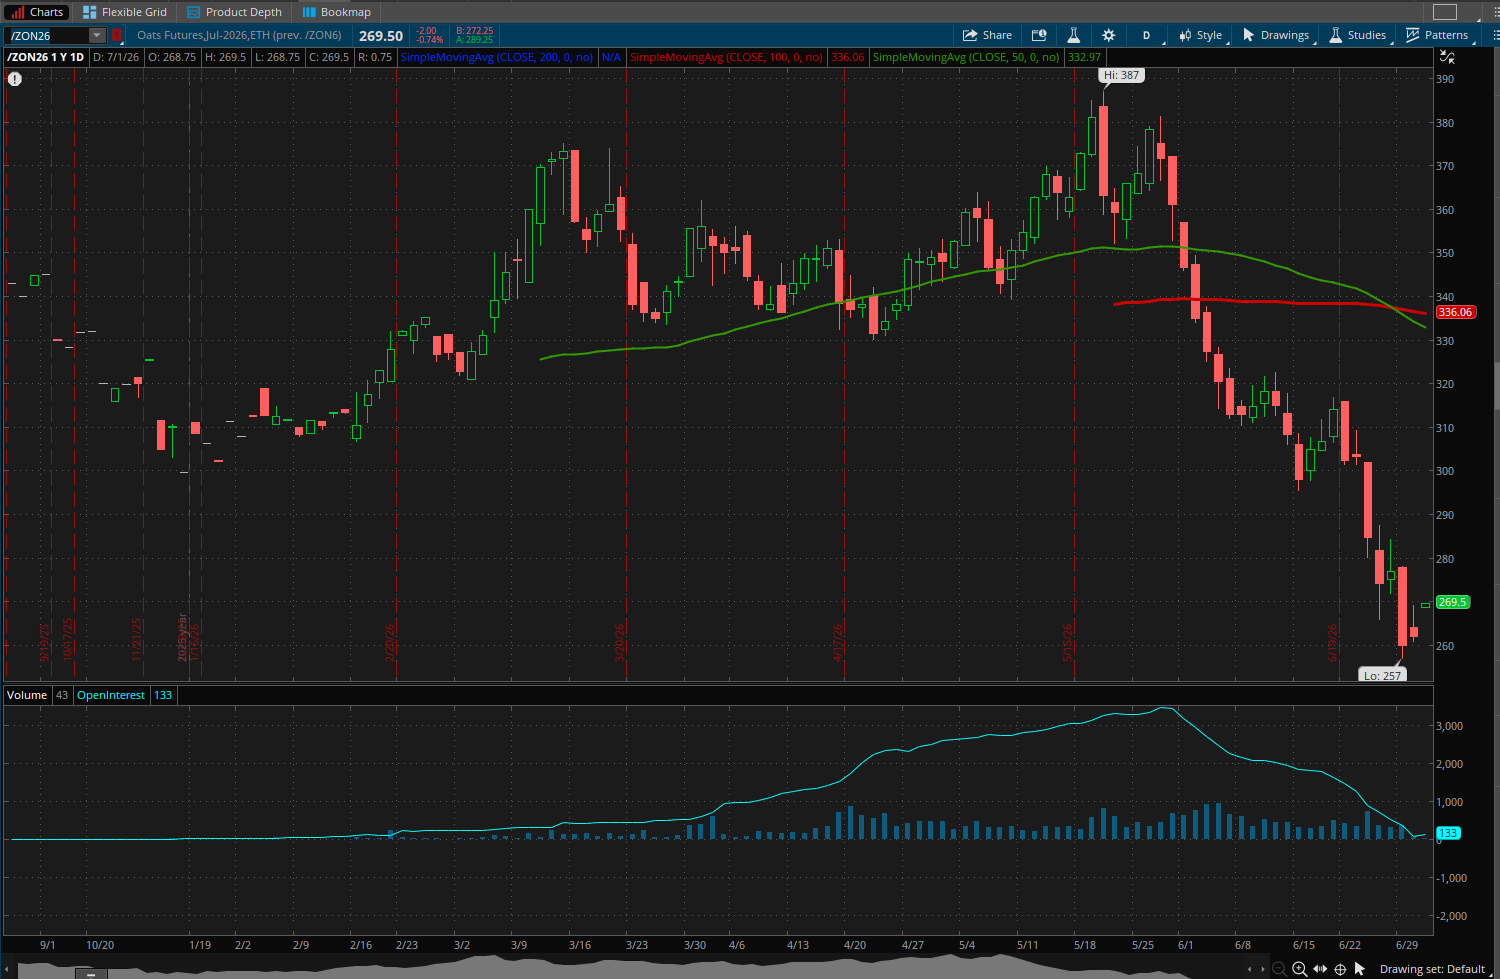
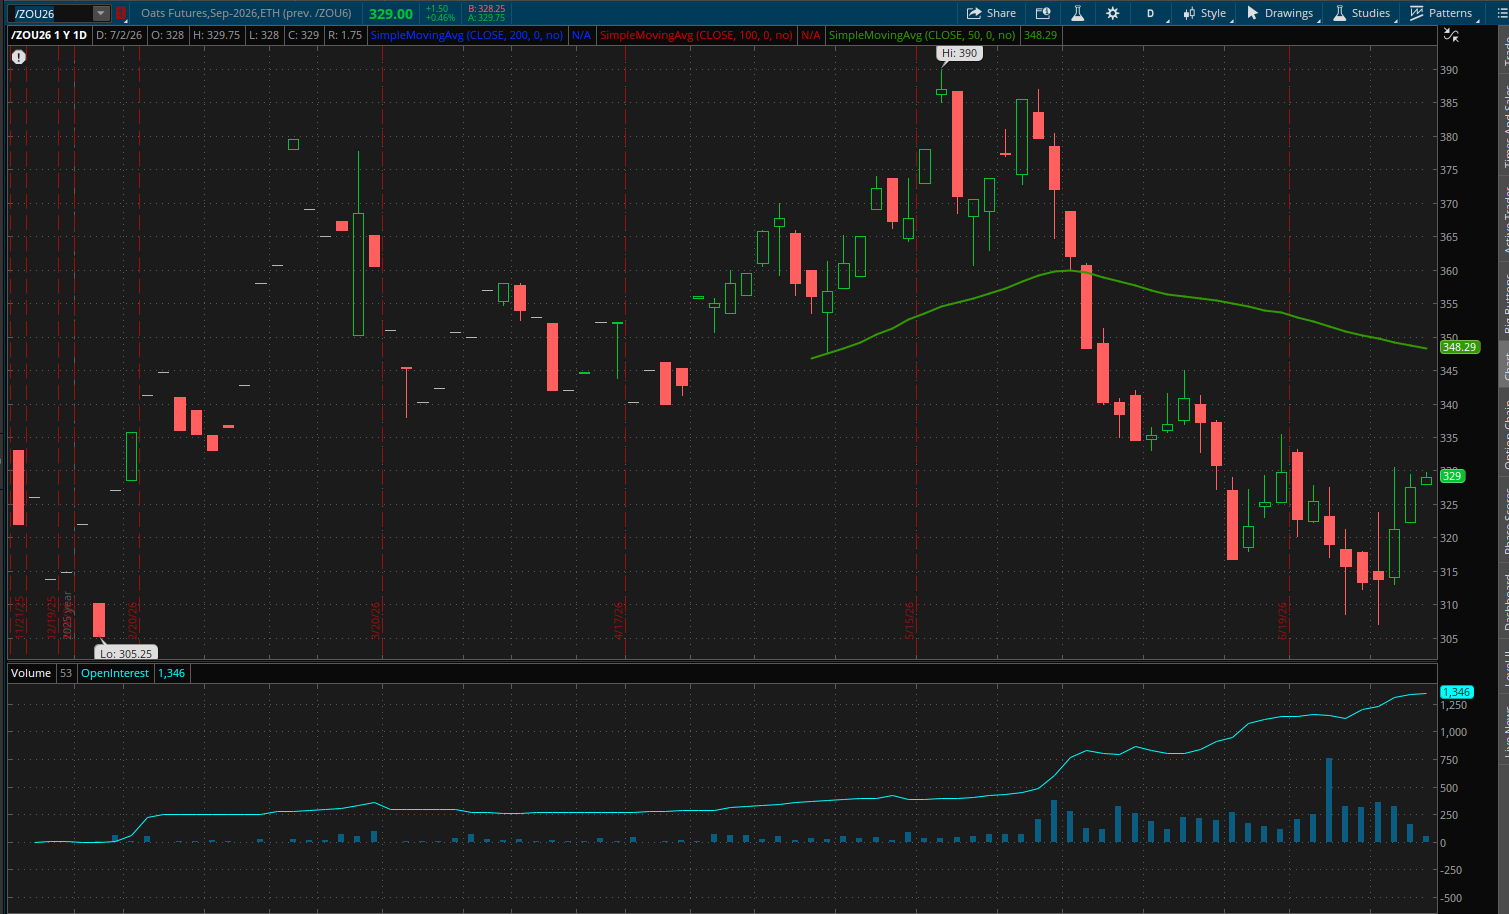
Oats Futures stabilize after front-month contracts roll

The Dow Jones Industrial Average ($DJI) breached 53,000 on Monday. That milestone was reached five months to the day after hitting 50,000. It also came about a month after all-time highs for the S&P 500 (SPX) and NASDAQ-100 (NDX). Rotation between sectors combined with interest rate expectations and corporate earnings to lead the blue-chip index higher.
For the rotation story, we can examine sector performance over the past month. Healthcare is the top performing sector over the past month (+7.8%), with financials (+7.4%) and industrials (+4.9%) close behind. Those three sectors combined make up nearly 60% of the index. The S&P 500 in comparison, has larger sector exposure to some relative laggards, with information technology (-1.4%) and communication services (-0.2%) making up nearly 50% of the index. The NASDAQ-100 is even more concentrated, with those two sectors making up over 70% of the index. That said, keep in mind the other indexes are only a few percentage points off all-time highs, thanks in large part to those information technology stocks, which are up 15% for the year, good for third place among the eleven major sectors.
Interest rate expectations have moderated recently, assuming a less-hawkish Fed policy path through the next year. The CME FedWatch Tool shows rates traders have lowered their expectations for interest rates for the end of the year. Two weeks ago, Fed Funds futures prices indicated a probability of two or more rate hikes through the December FOMC meeting was greater than 50%. Following softer-than-expected jobs data, the chance of two or more hikes is around 1 in 3. The change is partly due to weaker jobs data last week. ADP’s non-farm payrolls grew by 98k versus 118k expected, while the BLS Employment Situation Summary reported job growth of 57k in June, coming in at half the forecast of 114k new jobs.
Earnings growth among the top components of the index range has been strong. Four of the top five components by weight grew earnings by 20% or more quarter-over-quarter. The two largest components, Goldman Sachs (GS), and Caterpillar (CAT), had earnings growth of 24.3% and 21.4% respectively, while the fifth-largest component Alphabet (GOOGL) saw earnings growth of 81.8%.
Speaking of component weights, you might wonder why Goldman Sachs and Caterpillar have higher index weights than Alphabet given the sizes of the companies. In fact, Goldman Sachs and Caterpillar each have index weights over 10%, while Alphabet makes up around 4%. This is true even though the market cap of GOOGL is over three times the combined market cap of GS and CAT. That is because the Dow Jones Industrial Average weights its components by price per share rather than market capitalization. That means a stock trading for over $1000 per share like GS is twice as large a part of the index than a stock trading below $400 like GOOGL. The price-weighting methodology is a historical quirk of the index, due to the complexity of calculating market capitalization of all components by hand in 1896 when the index was created.
While the index has outperformed its neighbors over the past month, a return to money flowing into AI and chip stocks could lead to reversal in relative index performance. The Fed’s path is uncertain, so inflation and employment data will bear watching. On a related note, the situation in the Middle East could lead to higher-for-longer energy prices and a knock-on effect on inflation.
On a one-year daily chart the Dow Jones e-mini futures (/YM) tracked higher from the low in early August for six months. That turned around with a selloff that lasted about six weeks. Since this year’s low in late March, the contract has roughly returned to the trend that broke in February. The recent strength briefly pushed the Relative Strength Index to an overbought level. On the other hand, the Directional Movement Index shows a bullish trend.
New Products
New futures products are available to trade with a futures-approved account on all thinkorswim platforms:
- Ripple (/XRP)
- Micro Ripple (/MXP)
- 100 OZ Silver (/SIC)
- 1 OZ Gold (/1OZ)
- Solana (/SOL)
- Micro Solana (/MSL)
Visit the Schwab.com Futures Markets page to explore the wide variety of futures contracts available for trading through Charles Schwab Futures and Forex LLC.