Weekly Trader's Outlook
Will AI Concerns Thwart a Potential Santa Clause Rally?

The Week That Was
If you read last week's blog, you might recall that my forecast for this week was "neutral" for the first half of the week and "higher volatility" for the back half of the week, citing the FOMC meeting and Oracle earnings on Wednesday. The S&P 500 was slightly lower heading into the Fed policy decision on Wednesday but subsequently rallied ~1% post-FOMC and is selling off nearly 1% today. Meanwhile, the S&P 500 Equal Weight (SPXEW), Dow Jones ($DJI) and Russell 2000 (RUT) all broke out to fresh all-time highs yesterday but are also pulling back today. So, what's creating all the volatility? It's a combination of a relatively accommodative tone out of the FOMC meeting (more on this in the "Economic Data, Rates & the Fed" section below) and concerns around Oracle and overspending in general on the AI infrastructure buildout. Regarding Oracle's earnings release on Wednesday after the bell, the company announced mixed results (EPS beat, slight revenue miss), but more importantly, increased FY26 CapEx from a prior forecast of $35B to $50B. Fueling negative sentiment is a sharp sell-off in Broadcom (AVGO - $41.26 to $365.11), despite a strong quarterly report, and a Bloomberg news story from earlier today stating that Oracle has pushed back the completion dates for some of the data centers its developing for OpenAI to 2028 from 2027 (Oracle subsequently denied the story which is helping tech stocks recover some losses). As a result, markets have been contending with the bullish backdrop of a firm U.S. economy, a cooperative Fed, bullish seasonality and a healthy broadening of the rally versus concerns around AI (and whether the rally can continue if tech underperforms) and potentially higher long-term yields (30-year Treasury yields are hitting 3-month highs today).
Outlook for Next Week
At the time of this writing (2:00 PM ET), stocks are lower across the board, but off the lows of the session (DJI - 185, SPX - 64, $COMP - 334). Stocks recovered modestly off the lows of the session after Oracle denied an earlier Bloomberg report, stating that the company is pushing out some data center buildouts for OpenAI to 2028 to 2027. Oracle said there are no delays on any of the sites required to meet commitments to OpenAI, but ORCL credit default swaps are still up 10% on the day to 145 basis points. Outside of lingering concerns around overspending in AI, the backdrop for stocks appears to be relatively bullish. Yes, longer-term Treasury yields are elevated, but that appears to be driven by higher economic growth expectations. The technicals registered some bullish signals this week with the SPXEW, DJI and RUT all hitting fresh all-time highs. And bullish historical seasonality plus the potential for performance chasing by fund managers also lean in the bull's favor. Next week there are several potential market-moving catalysts on deck, including a Nonfarm Payrolls report, Retail Sales, CPI data and a Bank of Japan (BOJ) meeting on Thursday/Friday. If the BOJ is more hawkish than expected, this could push JGP yields higher which, in turn, likely lifts U.S. Treasury yields. So, the potential for higher volatility is there. Although tech stocks might see continued underperformance in the near-term, the "rotation trade", coupled with my bullish reasoning provided above leaves the potential for more upside next week in my view. Therefore, my forecast for next week is "Moderately Bullish". What could challenge my forecast? Persistent selling in tech stocks on AI concerns could pull investor sentiment down, or negative surprises from the catalysts I referenced could lead to weekly losses.
Other Potential Market-Moving Catalysts
Economic:
- Monday (12/15): Empire State Manufacturing, NAHB Housing Market Index
- Tuesday (12/16): Average Workweek, Average Hourly Earnings, Building Permits, Business Inventories, Capacity Utilization, Housing Starts, Industrial Production, Nonfarm Payrolls, Retail Sales, Unemployment Rate
- Wednesday (12/17): Business Inventories, EIA Crude Oil Inventories, MBA Mortgage Applications Index, Retail Sales
- Thursday (12/18): Continuing Claims, Consumer Price Index (CPI), EIA Natural Gas Inventories, Initial Claims, Leading Inventories, Net Long-Term TIC Flows, Philadelphia Fed Index
- Bank of Japan (BOJ) Monetary Policy Meeting (December 18-19th)
- Friday (12/19): Existing Home Sales, Q3 GDP – Third Estimate, PCE Prices, Personal Income, Personal Spending, University of Michigan Consumer Sentiment - Final
Earnings:
- Monday (12/15): MindWalk Holdings Corp. (HYFT), Navan Inc. (NAVN), US Gold Corp. (USAU)
- Tuesday (12/16): Duluth Holdings Inc. (DLTH), Lennar Corp. (LEN), Waldencast PLC (WALD), Worthington Enterprises Inc. (WOR)
- Wednesday (12/17): ABM Industries Inc. (ABM), Enerpac Tool Group Corp. (EPAC), General Mills Inc. (GIS), Jabil Inc. (JBL), Micron Technology Inc. (MU), Toro Co. (TTC)
- Thursday (12/18): Accenture PLC (ACN), Birkenstock Holding PLC (BIRK), CarMax Inc. (KMX), Cintas Corp. (CTAS), Darden Restaurants Inc. (DRI), FactSet Research Systems Inc. (FDS), FedEx Corp. (FDX), HEICO Corp. (HEI), KB Homs (KBH)Nike Inc. (NKE)
- Friday (12/19): Carnival Corp. (CCL), Conagra Brands Inc. (CAG), Lamb Weston Holdings Inc. (LW), Paychex Inc. (PAYX), Winnebago Industries Inc. (WGO)
Economic Data, Rates & the Fed
There was a moderate dose of economic data for investors to digest this week, highlighted by the 2-day Federal Open Market Committee (FOMC) meeting. Based on the price action, markets gave the FOMC meeting and Powell commentary a dovish tilt, as Treasury yields dropped yesterday and fresh all-time highs were hit in the Dow Jones, S&P 500 Equal Weight and Russell 2000 indices. Yields are rebounding today, but it's unclear whether the move is tied to a re-assessment of rate trajectory or expectations for stronger longer-term growth (30-year Treasury yields are hitting three-month highs today). Here's the breakdown from this week's reports:
- FOMC Meeting (Dec 9-10th): As expected, the Federal Reserve cut the Fed Funds Rate 25 basis points to a range of 3.50-3.75% and the Fed's dot plot suggests only 1 more 25 basis point cut in 2026. Perhaps of more significance, the dot plot revisions showed stronger GDP growth forecasts in 2025/2026 and slightly lower inflation expectations The Fed also announced its intention to start technical buying of Treasury bulls to help manage market liquidity. While not officially a "quantitative easing" announcement, markets interpreted the move as a dovish surprise, at least initially.
- JOLTs – Job Openings: The number of job openings in October increased from 7.658M in the prior month to 7.67M, which was well above the 7.12M economists were expecting. The figure is above pre-pandemic levels and indicates a tighter-than-expected labor market.
- Leading Indicators: -0.3% vs. -0.3% in the prior month.
- NFIB Small Business Optimism Index: Rose 0.8 points in November to 99.0, which was slightly above the 98.4 economist had expected. The net percent of business owners raising average selling prices rose 13 points to 34%, which represents the highest reading since March 2023. The net percent of owners expecting better business conditions declined 5 points to 15%.
- Employment Cost Index: +0.8% vs. +1.0% est.
- Initial Jobless Claims: Initial applications for US jobless benefits jumped 44K from the prior week to 236K, which was above the 220K economists had expected. The report suggests that there was likely some seasonal impact to last week's three-year low reading. Continuing Claims dropped significantly to 1.838M from 1.939M week-over-week and was well below the 1.947M expected.
- EIA Crude Oil Inventories: -1.81M barrels
- EIA Natural Gas Inventories: -177 bcf
- The Atlanta Fed's GDPNow "nowcast" for Q3 GDP was revised up to 3.6% yesterday from 3.5% on December 5th, which was primarily driven by modest an increase in the nowcast of the contribution of net exports to second-quarter real GDP from 0.86% to 1.01%.
U.S. Treasury yields rose across the board this week, despite a Fed rate cut, and the yield curve steepened. Compared to last Friday, 2-year Treasury yields are up ~3 basis points (3.535% vs. 3.564%), 10-year yields are up ~5 basis points (4.192% vs. 4.139%), while 30-year yields pushed higher by ~7 basis points (4.86% vs. 4.792%).
Expectations around rate cuts from the Federal Reserve eased slightly this week following this week's FOMC meeting. Per Bloomberg, the probability of the next 25 basis point cut from the Fed in 2026 is either April (81%) or June (theoretical 100%). It makes sense to me that the June FOMC meeting will reveal a rate cut since the new Fed Chairman will officially be at the help, and Trump's nomination is expected to lean dovish. However, the probabilities are still pointing to a total of two 25 basis points cuts in 2026, even though the latest revisions to the Fed's dot plot only suggest one in 2026 and one in 2027.
Technical Take
S&P 500 Equal Weight Index (SPXEW - 31 to 7,837)
While the (cap-weighted) S&P 500-index has failed to eclipse its all-time of 6,920 hit back on October 29th, the S&P 500 Equal Weighted (index (SPXEW) broke out above resistance (~7,800) yesterday to fresh all-time highs, which suggests broader participation. It also signals weakness in mega-cap tech, which has been hurt by Oracle news flow and souring sentiment around AI. While the breakout to fresh all-time highs is an obvious bullish technical event, the bulls would like to see the index hold ground above prior resistance (~7,800) next week for confirmation, and to avoid the perception of a potential "head fake".
Near-term technical translation: bullish, provided the index remains above 7,800
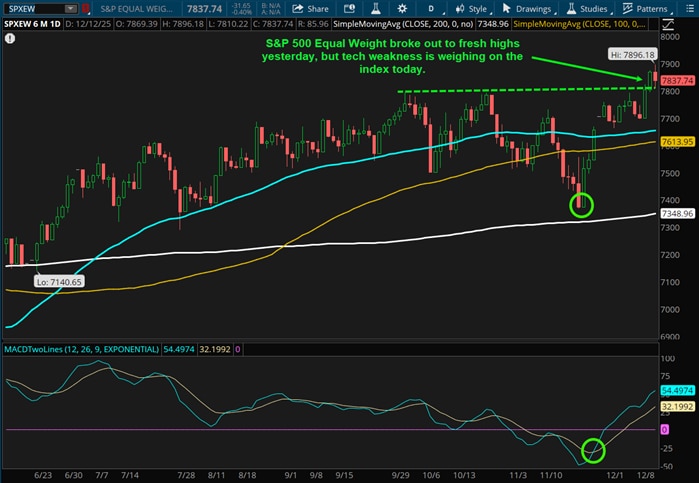
Source: ThinkorSwim trading platform
Past performance is no guarantee of future results.
Russell 2000 Index (RUT - 28 to 2,562)
Like the SPXEW, the Russell 2000 Index (RUT) broke out to a fresh all-time high this week and market breadth moved up to a new 52-week high (see "Market Breadth" section below). Both are bullish indicators, and both suggest a broadening of the bull market. Today's softness in the RUT can be attributed to selling in the tech space, but if the index remains above 2,540 next week, the technicals remain in the bull camp. The only potential concern on this breakout would be if Treasury yields creep higher in the coming weeks (next week there is a BOJ monetary policy meeting which is expected to result in a rate hike), since this index tends to be more sensitive to borrowing costs.
Technical translation: moderately bullish

Source: ThinkorSwim trading platform
Past performance is no guarantee of future results.
Cryptocurrency News
On Tuesday the Office of the Comptroller of the Currency announced new guidance that will allow banks to act as intermediaries on crypto exchanges. While the banks will not hold any cryptocurrency assets in inventory, they can engage in what are known as "riskless principal" transactions, effectively acting as brokers that will facilitate transactions between counterparties. The move represents another step towards bridging the gap between traditional finance (TradFi) and decentralized finance (DeFi), or digital "on chain" assets.
Market Breadth
The Bloomberg chart below shows the current % of members within the S&P 500 (SPX), Nasdaq Composite (CCMP) & Russell 2000 (RTY) that are trading above their respective 200-day Simple Moving Averages (SMA). In short, stocks rallied this week, sans the Nasdaq, and market breadth expanded across the board. This week's standout was the RTY, as the index rallied to fresh all-time highs and market breadth expanded to 52-week highs. Yes, RTY market breadth at 68% is well below the 93% seen back at the peaks of 2021, but the recent outperformance is noteworthy. Compared to last Friday's, the SPX (white line) breadth has moved up to 63.58% from 61.04%, the CCMP (blue line) has increased to 52.74% from 50.18%, and the RTY (red line) has expanded to 68.38% from 63.50%.

Source: Bloomberg L.P.
Market breadth attempts to capture individual stock participation within an overall index, which can help convey underlying strength or weakness of a move or trend. Typically, broader participation suggests healthy investor sentiment and supportive technicals. There are many data points to help convey market breadth, such as advancing vs. declining issues, percentage of stocks within an index that are above or below a longer-term moving average, or new highs vs. new lows.
This Week's Notable 52-week Highs (103 today): Albemarle Corp. (ALB + $1.32 to $135.50), Broadcom Ltd. (AVGO - $36.07 to $370.25), Citigroup Inc. (C + $0.70 to $112.44), GE Vernova Inc. (GEV - $23.12 to $681.08), Micron Technology Inc. (MU - $8.77 to $249.69), Taiwan Semiconductor Inc. (TSM - $4.10 to $300.75)
This Week's Notable 52-week Lows (17 today): Arthur J. Gallagher & Company Inc. (AJG + $3.56 to $251.18), Costco Wholesale Inc. (COST - $6.07 to $878.41), Cracker Barrel Inc. (CBRL + $0.38 to $28.61), Diageo PLC (DEO + $0.92 to $88.71), Mondelez International Inc. (MDLZ + $0.36 to $54.15), T-Mobile US Inc. (TMUS + $1.33 to $196.66)