3 Stock Options Trading Stats on thinkorswim

Options statistics can offer a quick snapshot of market behavior at any given time. Key options statistics on the thinkorswim® platform can help option traders more effectively assess market sentiment and risk, potentially leading to more informed trading decisions. Traders can find these statistics, including proprietary Schwab indicators, by navigating to the Trade tab on the thinkorswim platform and scrolling down to select Today's Options Statistics, which appears below the Option Chain.
Let's break down three common options statistics that often serve as a starting point for understanding the market: implied and historical volatility, the Sizzle Index™, and the put/call ratio.
Source: thinkorswim platform
For illustrative purposes only.
Volatility measures
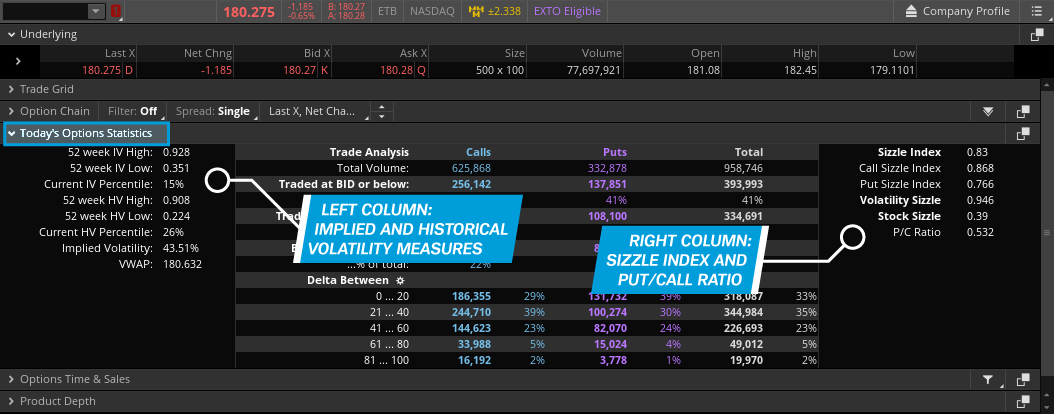
The left column of Today's Options Statistics is dedicated to measures of volatility, including historical volatility (HV) and implied volatility (IV).
IV is the market's forecast of future price variability in an underlying security. It's expressed as an annualized percentage and calculated using a theoretical options-pricing model that considers multiple variables, such as the prices of currently listed options and time to expiration.
For example, the stock in the image above shows a current IV reading of 43.51%. This indicates the options market is essentially pricing in roughly 44% annualized variability around the current underlying stock price. Additional data in the left column, like measures of current IV compared to readings over the past year, provide further perspective. Consider the following IV options statistics:
- 52-week IV High/Low. Over the last year, the stock in the above image has seen IV as high as 92.8% and as low as 35.1%.
- Current IV Percentile. Sometimes referred to as the IV rank, a reading of 15% means the current IV of 43.51% is within the lowest one-sixth of all IV readings over the past 52 weeks.
IV is relatively low in this stock right now, meaning the market expects fewer sharp price swings ahead. For more context, a trader might compare IV data to HV data.
While IV is a theoretical forward-looking measure implied by the options market, HV, in contrast, is backward-looking. Also known as actual or realized volatility, HV is a moving average of actual price variability in the stock over the previous 52 weeks. It's typically calculated using the annualized standard deviation of a security's price over a specific period of past trading days, such as 20, 30, or 90 days. Here's a look at the same volatility options statistics listed above, but for HV instead of IV:
- 52-week HV High/Low. Over the past year, the stock's HV has ranged from 90.8% to 22.4%, suggesting periods of both high and relatively static volatility.
- Current HV Percentile. At 26%, the current HV reading is slightly above the current IV percentile.
IV and HV typically tend to move in tandem. An IV that's lower than HV might suggest IV is understating the underlying stock's potential price variability, while an IV that's higher than HV might suggest the opposite. Comparing IV and HV can potentially be a useful way to understand how much expected volatility is priced into options versus how much volatility actually tends to materialize in the underlying security.
In general, for option buyers, higher IV relative to HV suggests options may be expensive, while lower IV potentially suggests options are inexpensive. However, when comparing these statistics, it's important to remember that past performance might not reflect future results.
Traders often use volatility options statistics to select trading strategies. Some strategies, such as buying single-leg options and long vertical or calendar spreads, are often considered more attractive in a low-volatility environment. Conversely, strategies such as covered calls, cash-secured puts, and short vertical spreads, might be more appealing in a high-volatility environment.
The Sizzle Index
The Sizzle Index, located in the right column of Today's Options Statistics, measures what's considered unusual options activity. It represents a ratio of a stock's current volume and its average daily volume (ADV) over the last five trading sessions.
For example, a Sizzle Index reading greater than 1.0 implies its current volume exceeds average volume over the last five trading sessions. A reading below 1.0 implies its current volume is lower than the average over the last five trading sessions. The further the Sizzle Index is from 1.0, the more the options' volume has deviated from its daily average. A Sizzle Index of 4.0 indicates volume four times its five-day average, while a reading of 0.5 indicates volume of half its five-day average.
Tracking unusual options volume can potentially offer traders hints about the strength of a directional move. For example, a spike in the Sizzle Index during a big up or down move in the stock price could potentially indicate strength in the trend's current direction, demonstrating significant interest and participation from option traders. Conversely, a big stock move without a corresponding spike in the Sizzle Index could potentially suggest a lack of conviction in the stock move and might even signal a reversal of the prevailing trend.
However, option traders looking to gain insights from the Sizzle Index should also consider monitoring the separate Sizzle readings for calls and puts. Understanding where the unusual options activity is occurring can provide clues about market sentiment or potential key price levels, based on the options trades driving the volume.
Want to learn more about how to use the Sizzle Index? Check out Schwab's Trader Talks coaching webcasts.
Put/call ratio
The put/call (P/C) ratio, located below the sizzle stats, is considered one of the oldest and most recognizable options statistics. It is determined by dividing the total put volume for an underlying security by its total call volume over a set period.
For example, if the volume of calls and puts is the same, the ratio would be 1.0. If twice as many calls traded as puts, it would be 0.5. And if puts had twice the volume of calls, the ratio would be 2.0.
Some traders assume the P/C ratio implies a directional bias. Higher put volume (such as a P/C ratio above 1.0) could imply bearish sentiment, while higher call volume could imply bullish sentiment. However, while this is a relatively common assumption, options volume doesn't always indicate directional bias in the market.
Options stats for technical traders and longer-term investors
Volatility, Sizzle Index stats, and the P/C ratio can be used in conjunction with other indicators to provide more context for trading strategies. Many traders who use technical analysis might use options stats along with moving averages, breakouts, or other chart tools (see image below). This could potentially help them confirm trends, measure sentiment for momentum trading, improve the timing of trade entries and exits, or manage risks.
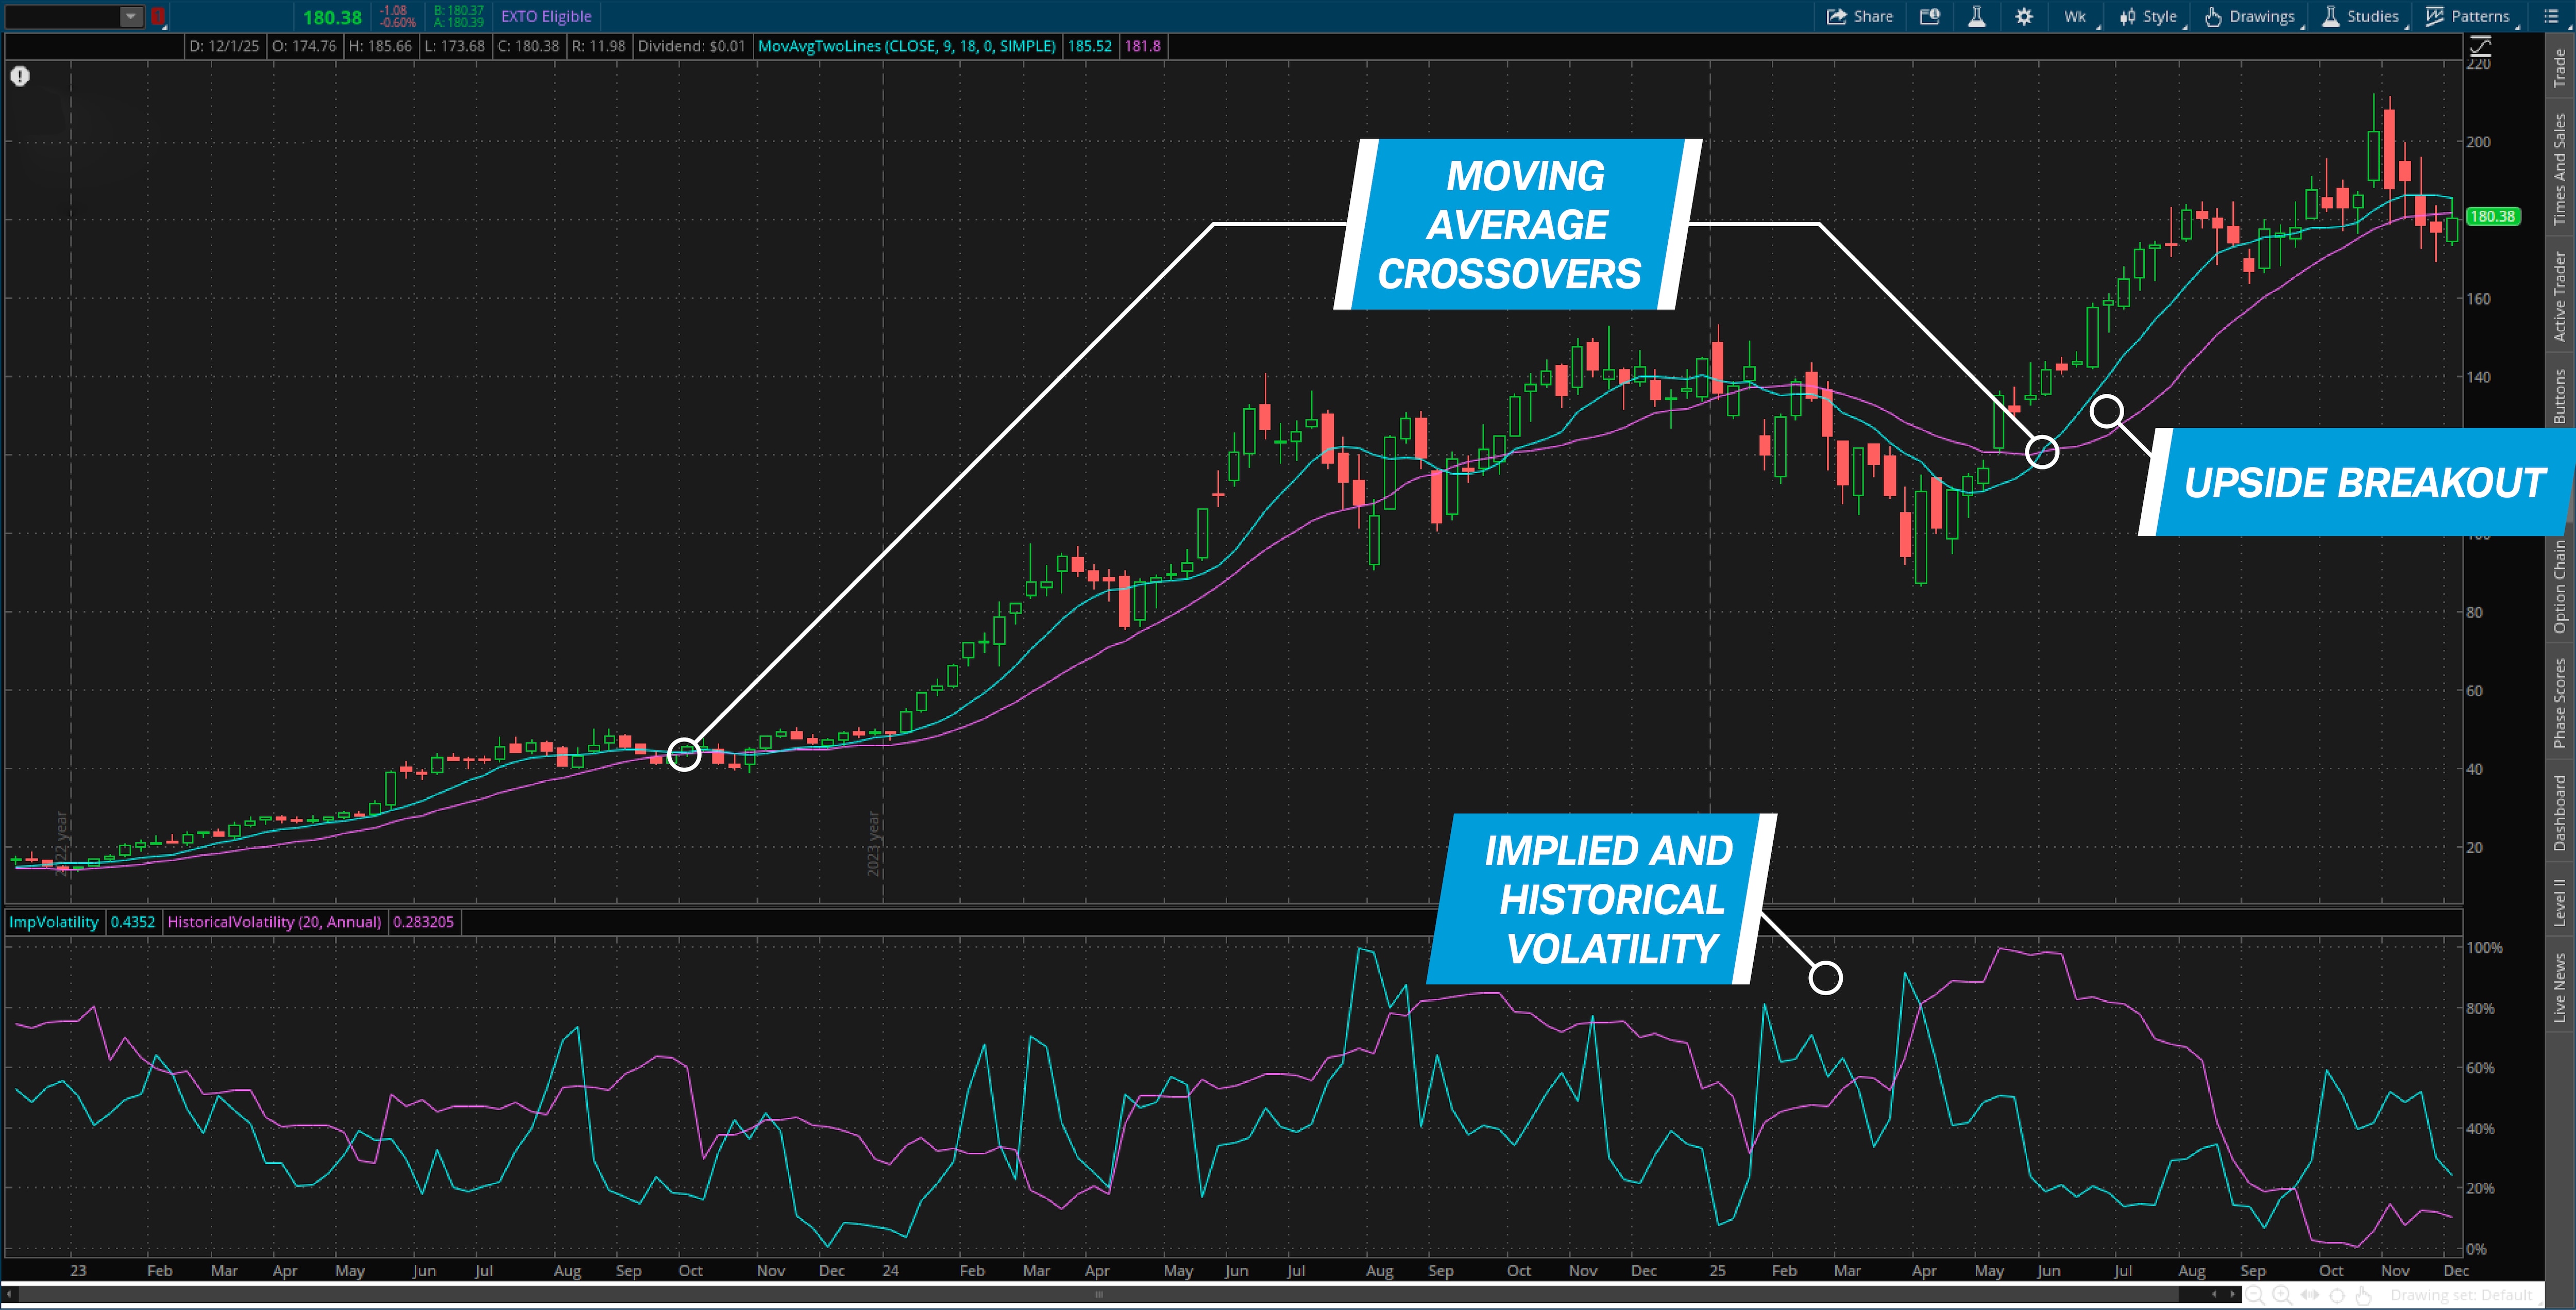
Source: thinkorswim platform
For illustrative purposes only.
Even longer-term investors who primarily follow fundamental indicators, such as company financials or macroeconomic data, might consider monitoring options statistics. Implied and historical volatility, the Sizzle Index, and the P/C ratio can potentially help traders gauge market sentiment or more effectively employ their risk management strategies. These data points can provide a useful, quantitative view into the positioning and expectations of both institutional and retail traders.