Close Ties: Corporate Bond Yields and Returns
Investors searching for attractive yields from high-quality fixed income may want to take a closer look at investment-grade corporate bonds.
These bonds—rated BBB-/Baa3 or higher—generally have low to moderate credit risk, as the issuing companies are considered more resilient to shifting economic conditions than, say, issuers of high-yield "junk" bonds. So, from the standpoint of credit quality, companies issuing these fixed income securities are generally thought to be financially stable.
Investment-grade corporate bonds are also sitting near the top of their range for the last 15 years. To put this into perspective, average yields on these securities with intermediate-term maturities currently fall in the neighborhood of 4.25% to 5.50%.1
Importantly, today's yields on investment-grade corporate bonds may be good indicators of their future total returns. This makes investment-grade corporate bonds an appealing option for investors who are particularly concerned about how their bond portfolio may perform when the future path of interest rates is at least somewhat unknowable.
Starting yields vs. total returns
The following chart, using data from the Bloomberg US Intermediate Corporate Bond Index, shows how starting yields and future total returns have matched up over the past 35 years.
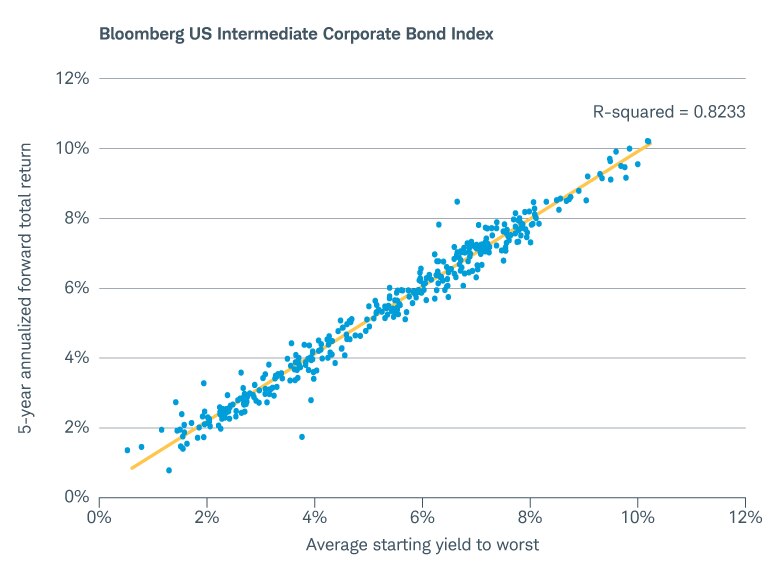
Sources: Schwab Center for Financial Research, Bloomberg. Monthly data from 1/31/1990 through 7/31/2025. The R-squared (R2), also known as the coefficient value, directly relates to how well the regression line captures the relationship between the variables in the scatter plot. Indexes are unmanaged, do not incur management fees, costs, and expenses, and cannot be invested in directly. For additional information, please see https://www.schwab.com/resource/index-and-investment-term-definitions. Past performance is no guarantee of future results, and the opinions presented cannot be viewed as an indicator of future performance.
The horizontal axis tracks the index's monthly starting yield to worst over the 35-year period. Note: yield to worst is a fairly conservative way to measure bond yields. Barring default, this is the lowest possible yield an investor might receive on a bond should the company redeem it before maturity.
The vertical axis tracks the index's average annualized total return for the five years following each monthly starting yield. And the blue dots show the total returns for each starting yield. Also worth noting is that we used intermediate-term corporate bonds because their interest rate sensitivities tend to stay fairly range-bound over time, allowing for less noisy results.
The yellow line, known as a regression line, shows the trend between starting yields and eventual total returns. The calculation to plot this line can be used to measure how closely the variables tracked each other during our period. The R-squared (R2) value shows how closely the variables match up with the regression line. If yields and returns were in perfect lockstep, the R2 result would be 1.0. Here, we end up with an R2 value of 0.8233.
So, with due recognition that past performance is no guarantee of future results, this chart suggests a fairly close historical relationship between investment-grade corporate bonds' starting yields and eventual total returns. This relationship may provide some comfort for bond investors who are looking for yield but are unsure about what the future might bring.
What to consider next
There are a number of ways to invest in investment-grade corporate bonds: exchange-traded funds (ETFs), mutual funds, and separately managed accounts are some of the most popular choices.
Looking for investment-grade corporate bond funds?
Explore ETFs at Schwab
For investors interested in adding to their fixed income allocations with investment-grade corporate bond funds, the Mutual Fund Select List or ETF Select List are two places to consider. Separately managed accounts represent another opportunity, offering professional management and ownership of each individual bond.
1Bloomberg USD Corporate IG BVAL Yield Curve, as of 8/29/2025. Schwab Center for Financial Research, "Bond Market Update—September 2025," accessed 09/09/25: https://www.schwabassetmanagement.com/content/bond-market-update.
The R-squared, also known as the coefficient value, is directly related to how well the regression line captures the relationship between the variables in the scatter plot.
Yield to worst is a measure of the lowest possible yield that can be received on a bond that fully operates within the terms of its contract without defaulting. It is a type of yield that is referenced when a bond has provisions that would allow the issuer to close it out before its scheduled maturity.