Dire Strait: War's Impact on Stocks

Key takeaways
- The central focus of the U.S./Israeli war with Iran is shifting from intensity to duration, especially as it pertains to how long traffic through the Strait of Hormuz (one of the most vital global oil chokepoints) remains disrupted.
- The United States stands in a better position relative to most developed countries when it comes to higher oil prices given its net oil exporter status and falling share of spending devoted to gasoline, but that doesn't mean a growth and/or inflation shock can't unfold if oil prices remain elevated.
- The war has both exacerbated the "smoke on the water, fire under the surface" nature of the U.S. equity market and led to a sharp reversal in U.S. equity underperformance relative to the rest of the world.
From an economic perspective, central to the war in Iran is the Strait of Hormuz—the only sea passage from the Persian Gulf to the open sea, which happens to transport about 20% of the world's oil. As you can see in the chart below, oil and liquefied natural gas (LNG ) flows through the strait have been disrupted to a significant degree, having nearly stalled out completely. While it is arguably semantics in saying that the Hormuz strait remains physically open to oil tankers, Iranian drone warfare and dangerous conditions have effectively meant safe passage by commercial and container ships is compromised, even when accompanied by the U.S. Navy and/or other global warships.
Strait to the bottom
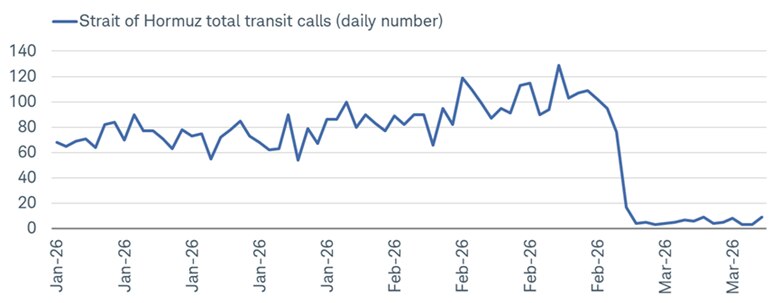
Source: Charles Schwab, UN Global Platform, IMF PortWatch (portwatch.imf.org), as of 3/15/2026.
A port transit call (or transit port of call) is a scheduled stop where a vessel docks to load/unload cargo, refuel, or change crew without it being the final destination for that cargo.
To put the strait's importance into perspective, consider the various global oil chokepoints in the chart below. These routes are critical to global oil and energy trade—not only because of their volume but also because of their security (or perceived security, at this point). The straits of Malacca and Hormuz dominate when it comes to volume, with the Cape of Good Hope a distant third. Per the Energy Information Administration (EIA), in the first half of 2025, total oil flows through the straits of Hormuz and Malacca averaged a combined 44.1 million barrels per day.
Strait to the source
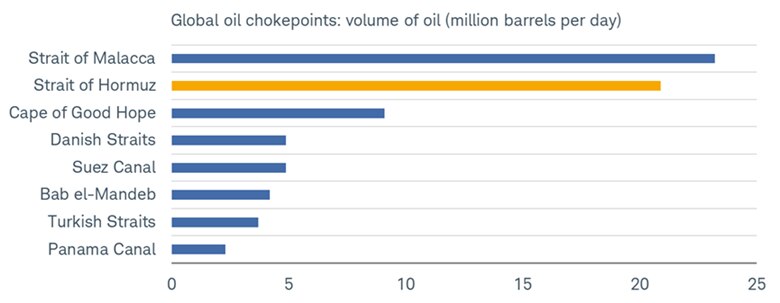
Source: Charles Schwab, Mauldin Economics, U.S. Energy Information Administration (EIA) Short-Term Energy Outlook (February 2026), as of June 30, 2025.
Chokepoints are narrow channels along widely used global sea routes that are critical to global energy trade and security because of the large volumes of petroleum and other liquids and liquified natural gas that pass through them.
Worth pointing out is the EIA's estimate that 89% of the crude oil and condensate moving through the Strait of Hormuz went to Asian markets in the first half of 2025. China, India, Japan, and South Korea were and remain the dominant recipients, making the United States' oil supply situation not nearly as dire. For the past several years, the United States has been in the relatively advantageous position of being a net oil exporter, per the chart below.
Post-pandemic export advantage
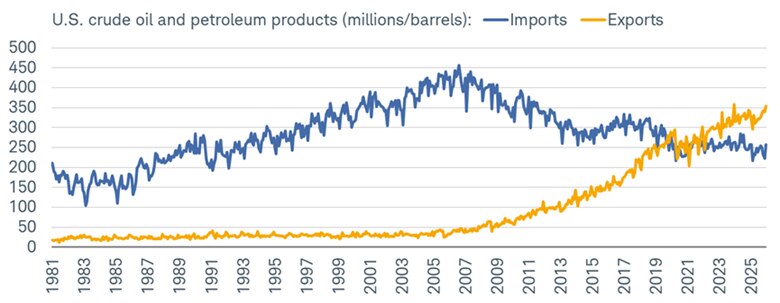
Source: Charles Schwab, Energy Information Administration (EIA), as of 12/31/2025.
That is also reflected in the secular decline in U.S. consumers' share of spending that is devoted to gasoline and other energy products. As you can see in the chart below, the share has fallen from a peak of 6.3% in 1980 to 1.9% as of January 2026. This has helped dampen the blow of energy spikes in the modern era—or put another way, has raised the bar for how high oil prices have to go to meaningfully hit U.S. consumption.
Waning energy intensity
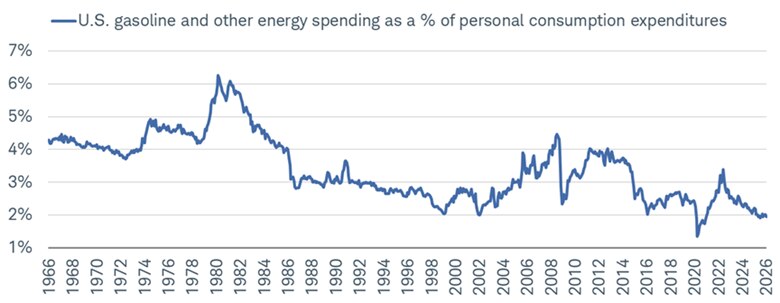
Source: Charles Schwab, Bloomberg as of 1/31/2026.
Still, though, this crisis is becoming less about the ultimate peak in oil prices and more about how long they remain elevated. The rub with the halting of most traffic through the Strait of Hormuz is that there is no viable alternative route, unlike other major chokepoints, as you can see in the following table.
Global oil chokepoints alternative routing options
| Chokepoint | Alternative route |
|---|---|
| Strait of Malacca | Around Sumatra (+ 2-3 days) |
| Strait of Hormuz | NO VIABLE SEA ROUTE |
| Cape of Good Hope | Is the alternative route |
| Suez Canal | Cape of Good Hope (+ 7-14 days) |
| Danish Straits | Limited overland pipelines |
| Bab el-Mandeb | Cape of Good Hope (+ 7-14 days) |
| Turkish Straits | Baku-Tbilisi-Ceyhan pipeline |
| Panama Canal | Cape Horn/Trans-Panama pipeline |
The longer that container traffic in the Strait of Hormuz is restricted, the higher the risk of oil prices staying higher for longer. Now that we are more than two weeks into the war, the intensity of the damage from missile strikes is becoming the less dominant issue, giving way to the duration of traffic disruption. Even if the United States were to come out and declare victory and/or a ceasefire imminently, questions would remain as to how long it would take for normal traffic in the Strait of Hormuz to resume. The resumption of both oil flow and production is now squarely in focus, and we would view a scenario in which oil prices take the elevator up and the escalator down as a negative development for the economy.
What say you, markets?
Brent crude has risen nearly 45% since the start of the war, exceeding the median 30% surge seen in previous large oil shocks, including the 1990 Gulf War, the 2003 Iraq War, and the 2022 Russian invasions of Ukraine. It's been a remarkable couple of weeks as it relates to the action in oil and the related impact on stocks, the U.S. dollar (USD), and Treasury yields.
Oil driving markets
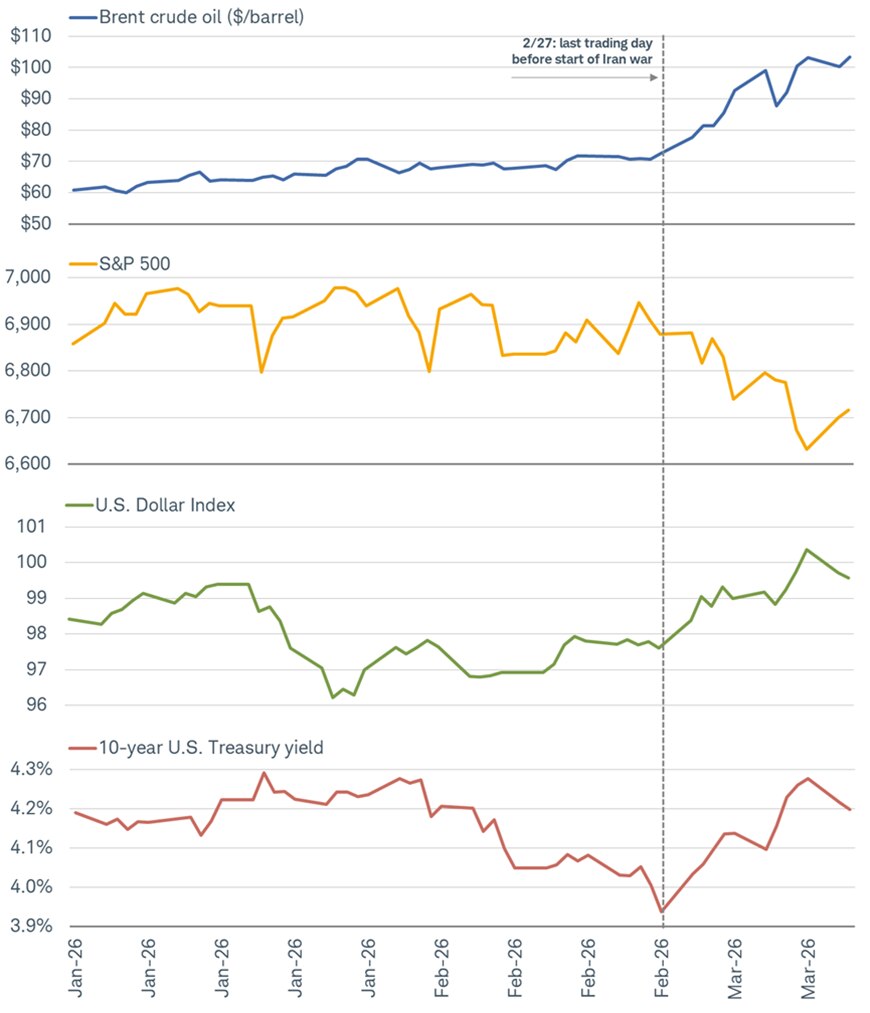
Source: Charles Schwab, Bloomberg, as of 3/17/2026.
Indexes are unmanaged, do not incur management fees, costs and expenses and cannot be invested in directly. Past performance is no guarantee of future results.
Conventionally, a major military conflict would send investors into U.S. Treasuries as a perceived safe haven, pushing yields lower alongside a typically lower U.S. dollar given the more common inverse relationship between oil prices and the dollar. In this conflict era so far, the U.S. dollar has strengthened, and Treasury yields have also risen…simultaneously. This is the fingerprint of a supply-driven inflation shock rather than a demand-destroying growth shock, and it has direct implications for the Federal Reserve's already-constrained room to maneuver.
The logic that has underpinned recent U.S. dollar strength is likely a function of traders determining that the United States is more insulated from the spike in oil prices given its aforementioned net exporter status. The logic underpinning the recent move higher in Treasury yields relates to the markets pricing in higher inflation risk from energy disruptions.
One thing leads to another
The defining financial market characteristic since the onset of the war in Iran has been the tightness and directionality of the relationship between crude oil and U.S. equities, shown below via the correlation between Brent crude oil (the global benchmark) and the S&P 500 on a rolling intraday basis.
Nearly all about oil prices
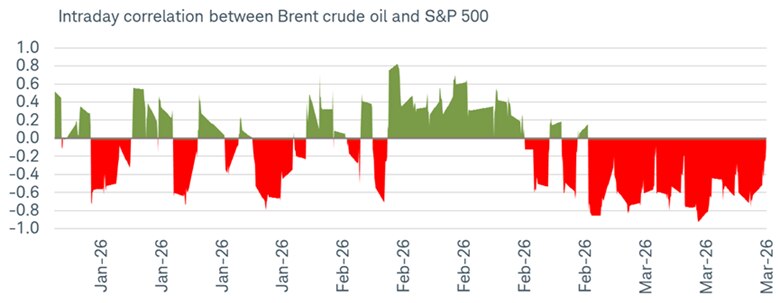
Source: Charles Schwab, Bloomberg, as of 3/17/2026.
Intraday correlation based on hourly increments. Correlation is a statistical measure of how two investments have historically moved in relation to each other, and ranges from -1 to +1. A correlation of 1 indicates a perfect positive correlation, while a correlation of -1 indicates a perfect negative correlation. A correlation of zero means the assets are not correlated. Indexes are unmanaged, do not incur management fees, costs and expenses and cannot be invested in directly. Past performance is no guarantee of future results.
The oil-equity relationship has fluctuated over time and has been driven by type of regime:
- Negative in the 1970s and 1990s—when higher oil prices were seen as pure economic damage)
- Near-zero during the 2000s "commodity supercycle"—when demand-driven oil gains and equity gains moved together
- Periodically positive in the post-quantitative easing (QE) era—when both tracked global risk appetite
The current configuration (albeit a short span so far) most resembles the classic stagflation-era (1970s) dynamic, where the spike in crude oil is raising concerns about consumer spending and corporate profit margins vs. being a sign of economic vitality. That is the nature of a supply-driven shock vs. a demand-driven spike.
A tale of two markets (upstairs vs. downstairs)
One of the most analytically significant features of this year so far—about which we've written extensively—has been the extraordinary gap between the S&P 500's index-level performance and the churn rotation occurring beneath the surface. The table below is one that goes on my (Liz Ann's) X feed every morning. It shows that at the index levels, maximum drawdowns this year have not reached correction (-10%) territory.
Major indexes and maximum drawdowns
- Index
- Index YTD return
-
Index maximum
drawdown
from YTD high -
Average member
maximum drawdown
from YTD high
-
IndexS&P 500Index YTD return-2%Index maximum
drawdown
from YTD high-5%Average member
maximum drawdown
from YTD high-16%-
IndexNasdaqIndex YTD return-3%Index maximum
drawdown
from YTD high-7%Average member
maximum drawdown
from YTD high-29%-
IndexRussell 2000Index YTD return2%Index maximum
drawdown
from YTD high-9%Average member
maximum drawdown
from YTD high-23%At the average member level, things have been much more volatile via a process of churn and rotation. Notwithstanding the minimal -5% drawdown for the S&P 500 at the index level, the average member has had a maximum drawdown of -16%. It's even more stark for the Nasdaq and Russell 2000, with member level average drawdowns in bear market territory at -29% and -23%, respectively. The Dow has been more insulated given its smaller number of constituents (and a higher weight in energy stocks).
Range-bound, but only on surface
From a technical standpoint, and shown below, the S&P 500 index has traded in a narrow band since its all-time high price on January 27.
Tight trading range at index level
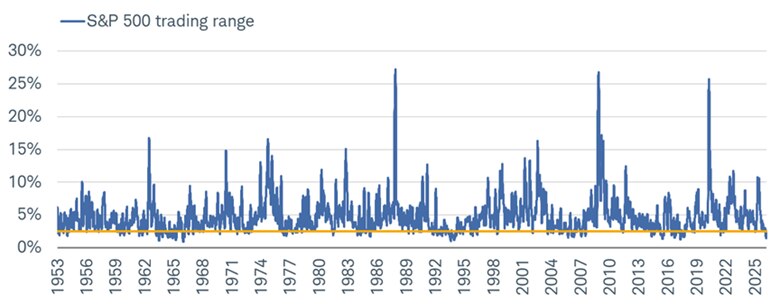
Source: Charles Schwab, Bespoke Investment Group, as of 3/17/2026.
Yellow line represents current reading. Trading range is measured as the range between one standard deviation above and below the S&P 500's 50-day moving average. Standard deviation measures the dispersion of data points relative to their mean, indicating how spread out numbers are. Indexes are unmanaged, do not incur management fees, costs and expenses and cannot be invested in directly. Past performance is no guarantee of future results.
This has often been billed as market "resilience," when in reality it has been the product of higher "distribution." While the S&P 500 index has been hovering near flat this year, beneath the surface, more rotation and dispersion is seen. As shown below, the share of S&P 500 members' year-to-date returns exceeding +/- 20% is running hot, with nearly as many stocks having extreme moves as those within the same range as the index itself.
Large tails around tight index range
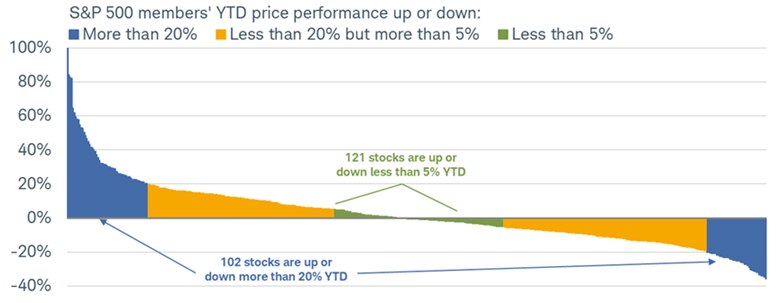
Source: Charles Schwab, Bespoke Investment Group, as of 3/17/2026. For illustrative purposes only.
Y-axis is truncated for visual purposes. Indexes are unmanaged, do not incur management fees, costs and expenses and cannot be invested in directly. Past performance is no guarantee of future results.
Inverted performance
The war has also produced sharp reversals in relative global equity performance and it has particularly punished markets that had been among the strongest performers through February, as shown below. The logic is energy vulnerability, with Europe and Asia more reliant on oil/gas imports and are particularly exposed to Middle East supply disruptions.
Before the war, our bias was toward international equity market outperformance, but in light of war-related uncertainties, we have "neutralized" the view on international vs. domestic.
Mirror image performance for indexes
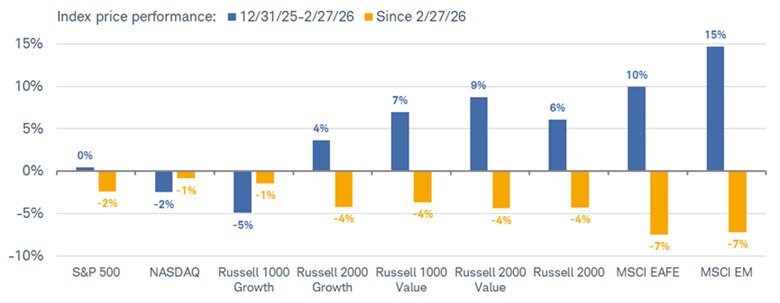
Source: Charles Schwab, Bloomberg, as of 3/17/2026.
Indexes are unmanaged, do not incur management fees, costs and expenses and cannot be invested in directly. Past performance is no guarantee of future results.
As for sector performance this year, the war has also led to some inverted performance relative to the first two months of this year, as shown below, notwithstanding Energy's leadership over both periods.
Mirror image performance for sectors
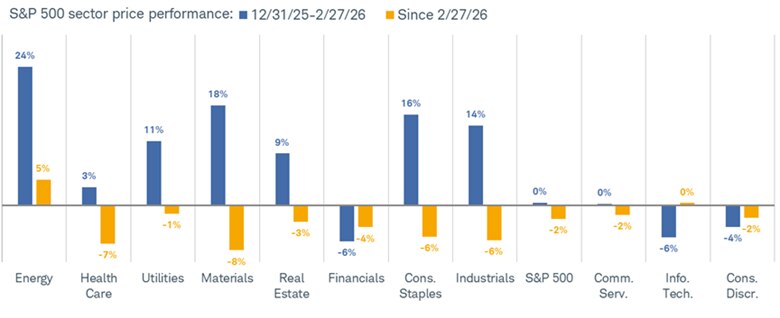
Source: Charles Schwab, Bloomberg, as of 3/17/2026.
Sectors are based on the Global Industry Classification Standard (GICS®), an industry analysis framework developed by MSCI and S&P Dow Jones Indices to provide investors with consistent industry definitions. Indexes are unmanaged, do not incur management fees, costs and expenses and cannot be invested in directly. Past performance is no guarantee of future results.
In sum
The 2026 period, especially since the onset of the U.S./Israeli war with Iran, presents one of the most analytically rich internal market environments in many years, in part because headline indexes are obscuring, rather than revealing, underlying stress. The war has not created these dynamics, but it has sharpened and extended them—tethering every trading session's tape to oil prices, which will likely remain the primary swing variable until the Strait of Hormuz's flows normalize.