2026 Mid-Year Outlook: Taxable Fixed Income

Key takeaways
- Going into the second half of 2026, inflation remains sticky and the Federal Reserve appears likely to stay patient. Along with fiscal concerns, rising global bond yields, elevated term premiums, and oil prices, those factors could keep upward pressure on long-term Treasury yields although those factors and our view may not materialize or persist. In our view, income still matters for bond investors in the second half of the year, but investors should be selective. We currently suggest investors favor below-benchmark average duration in their bond holdings, although that view could change if growth weakens materially or long-term yields rise enough to improve entry points.
- The three areas of the fixed income market where we currently see opportunities are investment grade corporate bonds, high-yield bonds, and preferred securities, though each comes with risks.
- The risks in the three areas of opportunities are that corporate bond spreads are low relative to Treasuries, high-yield bonds are more sensitive to changes in economic outlook and investor sentiment, and preferreds are more volatile than corporate bonds.
It's been a bumpy ride in the bond markets so far this year, and that trend may continue in the second half of the year. Inflation remains sticky, the Federal Reserve appears likely to stay patient, and we believe the 10-year Treasury yield may hold in the 4% to 4.5% range it has mostly held since early March, although there are risks to the upside. But keep in mind that past performance is no guarantee of future results. Geopolitical risks, especially in the Middle East, have also become more important for bond investors because of their potential impact on oil prices, inflation, and Fed policy.
Our broad message for the second half of 2026 is this: Income still matters, but investors should be selective. Despite the recent rise in Treasury yields, we suggest investors favor a below-benchmark average duration with their bond holdings, favoring short- and intermediate-term maturities. In our view, now is not the time to favor long-duration investments just yet.
Our more favorable areas of the fixed income market today include investment grade corporate bonds, high-yield bonds, and preferred securities. Each comes with risks, like the risk that prices fall relative to Treasuries if the economic outlook deteriorates, but we believe that all three offer compelling income opportunities in a market where Treasury yields may stay relatively elevated.
The Federal Reserve: An extended pause remains our base case
The Fed now appears to be in wait-and-see mode. Our base case is that the Fed remains on an extended pause for now, holding its benchmark interest rate steady through the end of the year. With the labor market having stabilized lately, the Fed will be paying attention to inflation for guidance on its next move, whether that's a hike or a cut down the road.
Most inflation indicators have been above the Fed's 2% target for five years and counting, and they are now moving in the wrong direction. With inflation expected to remain elevated, rate cuts do not seem likely anytime soon. Price stability is one of the Fed's dual mandates, so the fight against inflation is not yet done. Rate cuts when inflation remains elevated could pull it even higher if it spurs more spending.
That does not mean that the next move will necessarily be a hike, however. The risk of a rate hike has risen lately, but it is not our base case. The risks are two-sided—the next move by the Fed, whenever it comes, could be a hike or a cut.
The chart below highlights how much the outlook has changed since earlier this year. At the end of February, the Fed funds futures market was pricing in nearly three cuts by June 2027. Market expectations now point to a hike, but the implied probability has been fluctuating given so much uncertainty around the conflict in the Middle East and how various Fed officials have reacted to the recent increase in inflation in their recent speeches and interviews.
The fed funds futures market is now pricing in a rate hike rather than a cut
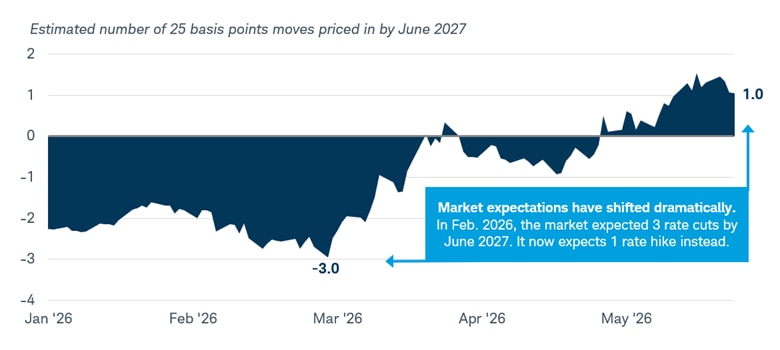
Source: Bloomberg, using data from January 1, 2026 through May 28, 2026.
Positive values indicate hikes; Negative values indicate cuts. The implied probabilities of hikes or cuts are derived from the fed funds futures market, using the Bloomberg function: World Interest Rate Probability (WIRP) Est Number of Moves Priced in for the US – Futures Model (US)ANM JUN2027 Index. For illustrative purposes only.
Futures and futures options trading involves substantial risk and is not suitable for all investors. Please read the Risk Disclosure Statement for Futures and Options prior to trading futures products.
Here are some factors that the Fed would likely consider before raising rates:
- If core inflation continues to move higher. The core personal consumption expenditures (PCE) index rose by 3.3% year over year in April, its highest reading since November 2023.
- Whether inflation expectations become unanchored. Rising inflation expectations can make inflation a self-fulfilling prophecy if it pulls forward consumer spending. So far, intermediate- and long-term inflation expectations remain somewhat anchored, although they've increased a bit over the last few months.
- If the labor market strengthens. Lately it's been "stable" rather than "strong," and the Fed might want to see a stronger labor market to handle tighter policy.
In other words, the Fed likely needs a clear reason to hike. Sticky inflation alone may keep the Fed on hold, but a more meaningful and sustained rise in inflation, or inflation expectations, would likely be needed to push policymakers toward a more hawkish stance.
The Middle East is an important risk to this outlook. A prolonged conflict could keep oil prices elevated, which would likely put upward pressure on inflation. Higher energy prices can work their way through the economy in a number of ways, from higher gasoline prices to transportation costs to broader input costs for businesses. If those pressures persist, the Fed may worry that inflation will take longer to return to its target. In that scenario, the risks would tilt more toward a rate hike.
On the other hand, a de-escalation in the Middle East could reduce that pressure. If tensions ease and oil prices fall, inflation concerns could moderate and the probability of a Fed hike would likely decline. That is one reason investors should pay attention not only to traditional economic data, such as inflation and jobs reports, but also to geopolitical developments and oil prices.
For investors, this outlook likely means short-term rates may remain stable.
Treasury yields: Range-bound, but with upside risks
We believe the 10-year Treasury yield will remain mostly in a 4% to 4.5% range over the near term. We see more risks to the upside than the downside, as there are a number of factors discussed below that should put upward pressure on yields. While a rising risk of recession is a key factor that could pull yields lower, that's not our base case.
The same factors that we expected to keep long-term Treasury yields elevated coming into the year are still present: sticky inflation, fiscal concerns, rising global bond yields, and the term premium. With inflation elevated, we think investors may continue to demand higher yields to compensate for the risk that it might not move lower anytime soon. Inflation can pose a meaningful risk to bond investors because even though the coupon rates are often fixed, rising inflation can eat away at the value of those coupon payments.
Oil prices are also part of the story. Treasury yields and oil prices have recently moved in the same general direction because oil has become a key signal for inflation risk. When oil prices rise, investors may worry that inflation will stay higher for longer, which can push Treasury yields up.
Treasury yields and oil prices have recently moved together
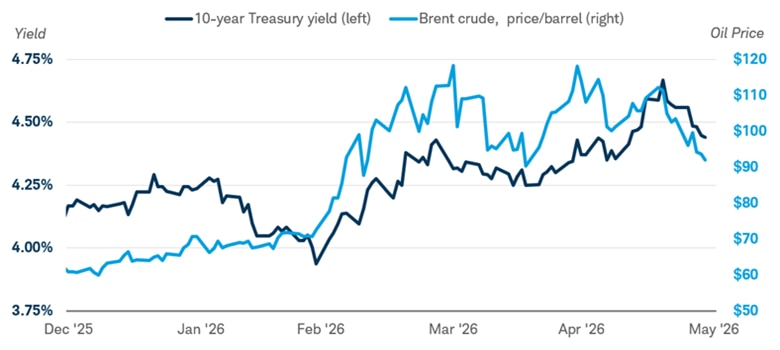
Source: Bloomberg, using daily data from 12/31/2025 through 5/28/2026.
Past performance is no guarantee of future results. For illustrative purposes only.
US Generic Govt 10 Yr (USGG10YR Index) and Generic Brent Crude 1st 'CO' Future (CO1 Index).
Another factor that could keep long-term yields elevated is the term premium. Put simply, the term premium is the extra yield investors demand to own a longer-term bond instead of a series of short-term bonds. For many years following the global financial crisis, the term premium was very low, likely driven by relatively low and stable inflation as well as the Fed's large bond-buying programs. Today, the environment looks different. Inflation uncertainty has risen, and the Fed is unlikely to use its balance sheet as aggressively as it did in the past. The term premium has risen from March 2020 lows but is still below the long-term average and well short of previous peaks. That could mean that the term premium continues to rise as investors require more compensation to hold long-term bonds, keeping long-term Treasury yields "higher for longer."
The term premium has risen, but remains below its long-term average
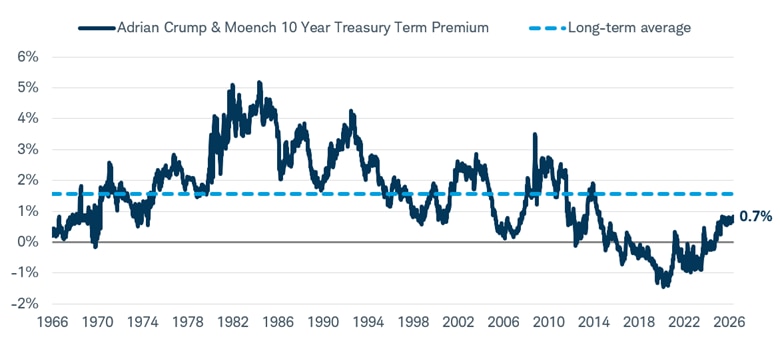
Source: Bloomberg.
Adrian Crump & Moench 10-year Treasury Term Premium (ACMTP10 Index). Weekly data from 1/7/1966 to 5/22/2026.
The term premium is the compensation that investors require for bearing the risk that short-term Treasury yields do not evolve as they expected. The term premium in the chart above is obtained from a statistical model developed by New York Federal Reserve Bank economists Tobias Adrian, Richard K. Crump, and Emanuel Moench. Past performance is no guarantee of future results.
For the 10-year Treasury yield to fall back below 4%, we think the economic backdrop would likely need to deteriorate with a rising risk of recession. In that environment, investors would likely seek the safety of Treasury bonds, and markets might begin to price in a greater chance that the Fed eventually cuts rates. That's not our base case, however.
Duration: Stay below benchmark, but don't hide in very short-term investments
Given this outlook, we favor a below-benchmark average duration.1 Since we believe the 10-year Treasury yield may stay in that 4% to 4.5% range and the risks are tilted somewhat to the upside, we do not think now is the time to aggressively add duration. If Treasury yields continue to move higher, there may be an opportunity for investors to consider more longer-term bonds, but we're not there yet.
That said, we also don't think investors should focus only on very short-term investments. Those investments can play a role in a portfolio, especially for liquidity needs, but it might mean investors sacrifice yield today. The yield curve is currently positively sloped, meaning investors can generally earn more income by moving somewhat further out in maturity. The largest yield increases since the end of February have been with yields in the two- to five-year part of the yield curve. Staying too short may come with an opportunity cost.
The yield curve remains upward sloping
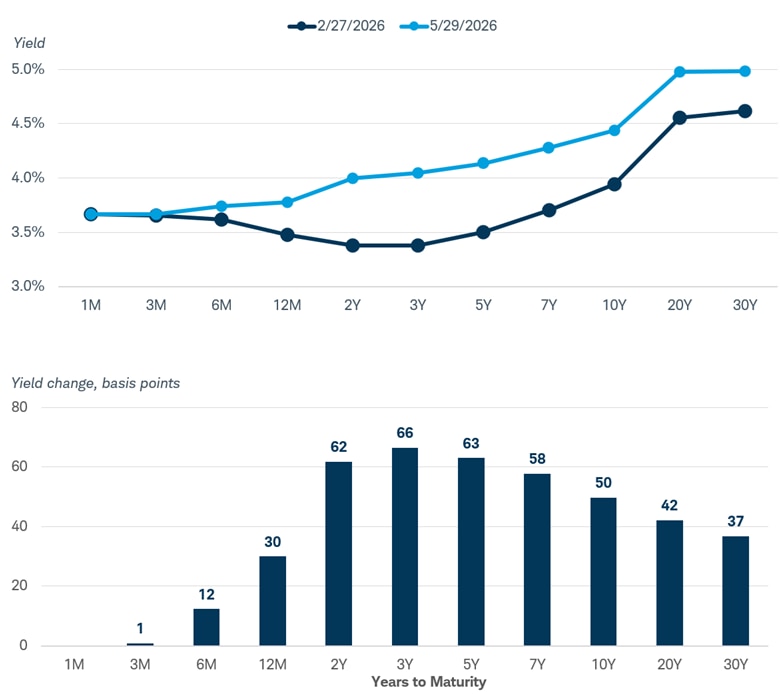
Source: Bloomberg.
U.S. Treasury Actives Curve (GC C15). Data as of 2/27/2026 and 5/29/2026. Bars show the change in yield for the various tenors of the yield curve, in basis points. Past performance is no guarantee of future results.
Potential opportunities in taxable credit
We see opportunities for investors to consider adding risk in moderation with investment grade corporate bonds, high-yield corporate bonds, and preferred securities.
Investment grade corporate bonds
Investment grade corporate bonds are one of our more favorable areas of the fixed income market. These are bonds issued by companies with higher credit ratings, and we believe they can play an important role for investors seeking income with a relatively higher-quality profile.
Two key factors supporting our view are attractive yields and relatively strong corporate fundamentals. The average yield on the Bloomberg US Corporate Bond Index is currently north of 5%, which is appealing relative to much of the post-financial-crisis period.
The yield advantage that investment grade corporates offer above Treasuries, known as the credit spread, is very low, however, and likely due to those strong fundamentals. Many investment grade companies have solid balance sheets, manageable debt levels, and access to capital markets. They have investment grade ratings for a reason.2 While the economy could slow, we do not currently see broad signs of stress among higher-quality corporate issuers.
That does not mean there are no risks. Corporate bond spreads—the extra yield investors receive relative to Treasuries—are low. If the economy weakens or risk appetite deteriorates, spreads could widen and corporate bond prices could fall relative to Treasuries. But for investors focused on income, we believe investment grade corporates remain attractive. We expect much of the potential return in the second half of the year to come from income payments, not price appreciation.
Investment grade corporate bond yields remain elevated
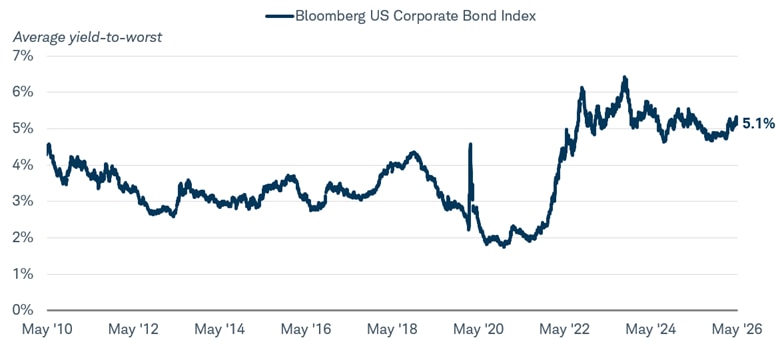
Source: Bloomberg, using daily data from May 28, 2010 through May 29, 2026.
Bloomberg US Corporate Bond Index (LUACTRUU Index). Yield-to-worst is the lowest yield that an investor can earn on a bond with an early-call option, barring default. Past performance is no guarantee of future results.
High-yield corporate bonds
Investors with an even greater risk tolerance can also consider high-yield bonds today, in our view. The story here is similar to our investment grade outlook: spreads are low but the absolute yields appear attractive. In an environment where the economy continues to grow near its trend growth rate, modest exposure to high-yield bonds may be appropriate.
High-yield bonds carry lower credit ratings than investment grade bonds, which means they are more sensitive to changes in the economic outlook and investor sentiment, and as such, they might not be appropriate for all investors. The biggest concern with high-yield bonds today is valuation. Because spreads are low, investors are not being paid as much extra yield as they have been in the past. That suggests investors should not expect much return from spread compression, meaning there's little room for high-yield bond prices to rise relative to Treasuries. And if spreads rise, their prices can fall relative to Treasuries.
Despite low spreads, we believe two important factors make high-yield bonds a bit more favorable today. First, the credit ratings in the Bloomberg US Corporate High-Yield Bond Index have been improving over the years, with bonds rated Ba making up more than 55% of the index. Much of that increase has come at the expense of Caa rated bonds, which we view as the junkiest of the junk. That makes the index relatively high quality within the broader high-yield universe.
The credit ratings of the bonds in the high-yield market have improved over the years
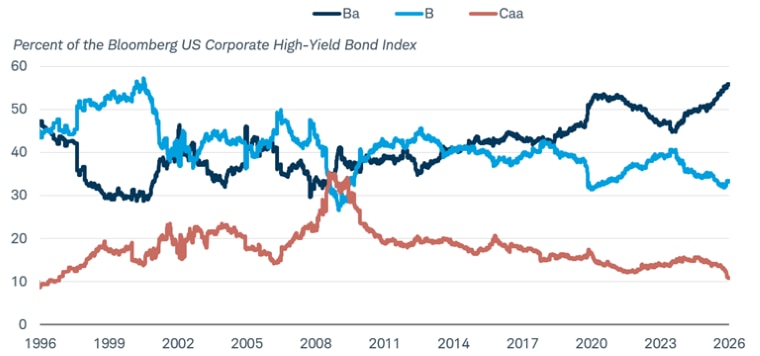
Source: Bloomberg, using weekly data from 5/27/1996 through 5/27/2026.
Lines represent the percent outstanding of the Ba, B, and Caa & Below subsets of the Bloomberg US High Yield Bond Index as a percent of that overall index.
The high-yield bond index also has a relatively low average duration. The Bloomberg US Corporate High-Yield Bond Index has an average duration of roughly three years, much lower than the average duration of the Bloomberg US Aggregate Index, which is just shy of six years. Our more favorable view on high-yield bonds is also in line with our "below benchmark" guidance on duration.
The average duration of the Bloomberg US Corporate High-Yield Bond Index has declined over the last few years
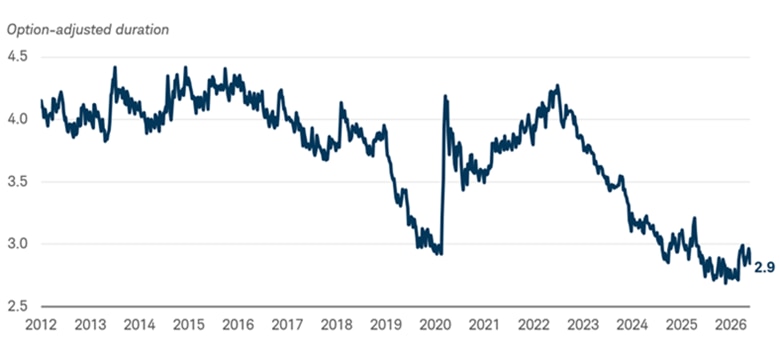
Source: Bloomberg.
Bloomberg US Corporate High-Yield Bond Index (LF98TRUU Index). Daily data from 1/1/2012 through 5/27/2026.
Option-adjusted duration (OAD) measures the sensitivity of a bond's price to changes in interest rates, accounting for embedded call options. Past performance is no guarantee of future results.
Preferred Securities
Preferred securities are another area we view more favorably today. At first glance, this may seem inconsistent with our view that investors should be cautious about adding long-duration exposure. While preferred securities often have long maturities, or no stated maturity at all, which can make them sensitive to changes in long-term yields, they are not simply long-term bonds. They are hybrid securities that share characteristics of both stocks and bonds. Their performance can be influenced by interest rates, credit conditions, bank and financial-sector fundamentals, and broader equity-market sentiment. In fact, preferred securities have historically been less correlated with long-term U.S. Treasuries than with the S&P 500, investment grade corporate bonds, and high-yield bonds.
Preferred securities performance has historically tracked credit more than Treasuries
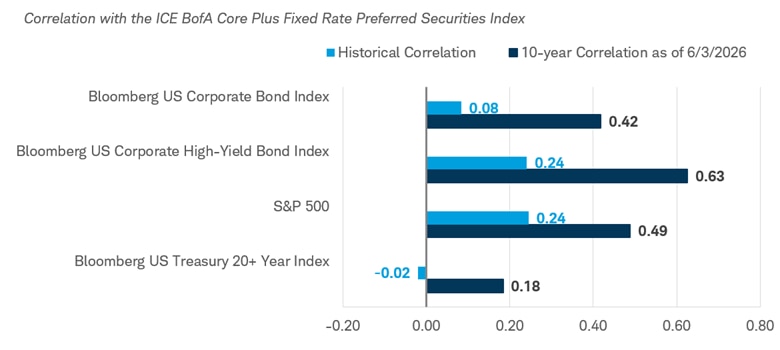
Source: Bloomberg.
Bloomberg US Corporate Bond Index (LUACTRUU Index), Bloomberg US Corporate High-Yield Bond Index (LF98TRUU Index), S&P 500 (SPX Index) and Bloomberg US Treasury 20+ Year Index (LT11TRUU).
Correlations shown represent an equal-weighted average of the correlations of each asset class with the ICE BofA Core Plus Fixed Rate Preferred Securities Index, using daily data. The dark blue columns represent correlation during the 10-year period between June 3, 2016 to June 3, 2026, while the light blue columns represent historical correlation from February 28, 1989 to June 3, 2026.
Correlation is a statistical measure ranging from +1 to -1 used to describe the relationship between two or more variables. A measure of +1 indicates that the variables are positively correlated and move in sync in both direction and magnitude. A measure of -1 indicates that the variables are negatively correlated and move in opposite direction and magnitude. And a measure of 0 implies no discernible relationship between the variables.
Past performance is no guarantee of future results.
Preferred yields have also risen more than the yields on investment grade corporate bonds lately. They come with different risks of course—subordination risk and lower average credit ratings—but the yield advantage makes the entry point attractive for investors willing to take a little extra risk today.
Preferred yields have risen more than investment grade corporate yields
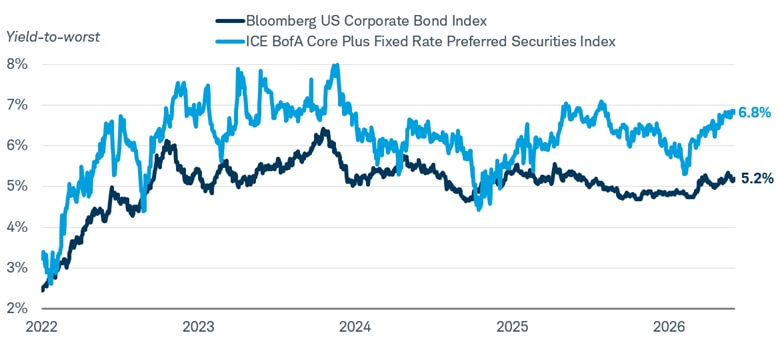
Source: Bloomberg, using daily data from 1/2/2022 through 5/28/2026.
Bloomberg US Corporate Bond Index (LUACYW Index) and the ICE BofA Fixed Rate Preferred Securities Index (P0P1 Index). Indexes are unmanaged, do not incur fees or expenses, and cannot be invested in directly. Past performance is no guarantee of future results.
Preferreds may also offer tax advantages. Many preferred securities pay qualified dividend income, which can be taxed at lower rates than ordinary bond income for some investors. That can make preferreds especially attractive in taxable accounts, particularly for investors in higher tax brackets. Investors should be careful, though: not all preferred securities receive the same tax treatment, and individual circumstances matter. Clients should consult a tax advisor when evaluating after-tax income opportunities.
The risks are important. Preferred securities generally rank below traditional corporate bonds in an issuer's capital structure, meaning bondholders typically have a higher claim on assets than preferred holders if a company runs into financial trouble. Preferreds can also be volatile, particularly when long-term yields rise or financial-sector stress increases. Many preferred issuers are financial companies, so investors should understand their sector exposure.
Even with those risks, we believe preferreds look more attractive today than they have in some time. For income-oriented investors who can tolerate volatility, preferreds may offer a compelling combination of yield and potential tax benefits.
What to consider now
Based on our outlook for the second half of 2026 above, Treasury yields may continue to stay in their recent range. Currently, yields across many fixed income investments still appear attractive, but we see more risk that yields move higher. We expect the Fed to hold rates steady for the next few meetings, and we favor a below-benchmark average duration, generally favoring short- and intermediate-term maturities. We do not believe now is the time to add too much duration to a portfolio given the potential upside risks to yields.
We have a more favorable view on investment grade corporate bonds, high-yield corporate bonds, and preferred securities. We acknowledge that spreads are low for many corporate bond investments, and that a resilient economy may keep spreads low. We encourage investors to focus on the yields that they offer, rather than potential price appreciation, and to be prepared for occasional volatility.
1 Duration measures how sensitive a bond or bond fund is to changes in interest rates. Duration is often related to a bond's maturity—longer maturities usually equate to higher duration—and the higher the duration, the more sensitive the investment is to the change in bond yields.
2 The Moody's investment grade rating scale is Aaa, Aa, A, and Baa, and the sub-investment grade scale is Ba, B, Caa, Ca, and C. Standard and Poor's investment grade rating scale is AAA, AA, A, and BBB and the sub-investment grade scale is BB, B, CCC, CC, and C. Ratings from AA to CCC may be modified by the addition of a plus (+) or minus (-) sign to show relative standing within the major rating categories. Fitch's investment grade rating scale is AAA, AA, A, and BBB and the sub-investment grade scale is BB, B, CCC, CC, and C.