Weekly Trader's Outlook
Stocks Hold Their Ground Despite Breakdown in U.S./Iran Relations

The Week That Was
If you read last week's blog, you might recall that I had an overall "Slightly Bullish" forecast for the market, coupled with the potential for "Higher Volatility" due to the catalyst-filled week. Stocks are on track to be down modestly for the week, so my forecast turned out to be wrong, but there was a heavy dose of volatility, particularly in tech and the chip stocks. The volatility within tech/semis was driven by higher uncertainties around the artificial intelligence (AI) secular growth story. First, on Monday, South Korean memory chip giant SK Hynix suffered its largest single-day drop in its history (-15.4%) after Korea Investment & Securities projected that the company's Q2 operating profit could fall short of estimates. The brokerage firm cited slowing growth in the company's average selling prices and slower-than-expected shipments for the HBM4 memory chip. Then, AI research lab PrismML confirmed that Apple is evaluating their technology which can compress massive AI models so that they can potentially run on-device and require up to 15 times less memory as a result. If you recall, back in March Google unveiled their new compression algorithm called TurboQuant that they claim uses 6x less memory. Less memory use would pull forward the timeline of the memory bottleneck which could result in a sooner-than-expected reduction in prices, which hit U.S.-based memory stocks this week. Micron is on track to be down 10% and SandDisk is on track to be down 24% this week. Then there's AI competition from China. Chinese startup Moonshot AI unveiled a new open-weight model called Kimi K3 that they claim rivals competing models from OpenAI and Anthropic at a lower cost. Moonshot plans on releasing the model weights by July 27th, which will allow developers to download, modify and build on top of it. Separately, following last Friday's ADR debut of SK Hynx, China-based DRAM-maker, ChangXin Memory Technologies (CXMT) has plans to IPO on the Shanghai Stock Exchange on July 27th. Lastly, within a couple of months, enterprises utilizing LLMs have shifted from "tokenmaxxing" to a "token efficiency" stance due to high token bills which have yielded limited productivity for those firms. It's unclear just how impactful these types of developments will be to the future revenue streams of the hyperscaler and semiconductor space, but investors shifted towards a "sell now, ask questions later" stance this week.
On the earnings front, Q2 results have been tracking exceptionally well, although it's early. The big banks delivered very strong results on Tuesday and Wednesday and semiconductor giants ASML and Taiwan Semiconductor delivered solid beat + raise quarters (though both stocks traded lower post earnings). So far, 47 of the S&P 500 companies have reported results and 76% have beat estimates on the top line while 95% have beat on the bottom line. The growth rates are tracking at +15.75% and +52.36% respectively.
Lastly, and potentially contributing to the down week for stocks is the 14% rise in WTI crude (August futures last traded + 4.79% to $82.73/barrel). Following the cancelation of the ceasefire between the U.S. and Iran, the U.S. has carried out six consecutive days of strikes against Iran, so the potential for escalation and/or higher oil prices is a risk for stocks in the coming weeks.
Outlook for Next Week
At the time of this writing (2:15 p.m. ET) stocks are lower across the board and near the lower end of today's range (DJI - 323, SPX - 70, $COMP - 331, RUT - 15), as investors may be taking down exposure ahead of the weekend. If oil prices are the barometer of how the Iran conflict is going, WTI crude being up 14% this week and at the highest levels since mid-June is not a good read. In terms of what the market has priced in, my sense is that investors felt the worst is behind us and a peaceful resolution will be reached by the (prior) 60-day negotiation window, but now its seems the tail risk is getting fatter. I hope a peaceful resolution is reached, and the sooner the better, but from an investing standpoint, I have to acknowledge the rising risk. Next week will be exceptionally light on the economic calendar, but heavy on the earnings front. As a whole, earnings are expected to be up 23% year-over-year per FactSet, so expectations are likely high. And of course, Alphabet's report on Wednesday will be important for the AI trade, especially in regard to capital expenditure (CapEx) guidance. Analysts are expecting a significant quarter-over-quarter (QoQ) and year-over-year (YoY) increase (Alphabet already raised full-year 2026 CapEx guidance to a range of $180-190B), so any deviation from the expectation (either higher or lower) could generate some ripples throughout the tech complex. Technically, we are oversold in the Nasdaq 100 and Philadelphia Semiconductor Index (SOX), so it wouldn't surprise me to see some mean reversion at some pint next week, and especially if Alphabet announces strong, or increased, CapEx guidance. However, I'm concerned that any escalation in the Iran conflict could weigh on Wall Street regardless of earnings reports. Therefore, I'm going to provide a "Cautious" forecast for the overall market next week, since I don't believe the potential risks are being fully priced in at current valuations. The risks I'm referring to are the following: AI return on investment (ROI)/spending concerns, higher oil prices due to the Iran conflict, higher inflation and rates driven by higher oil prices. The economy and earnings per share (EPS) growth forecasts are bullish, and the rally has been broadening (which is healthy), but I also feel there are just too many risks that are being overlooked right now.
Other Potential Market-Moving Catalysts
Economic:
- Monday (July 20): no reports
- Tuesday (July 21): no reports
- Wednesday (July 22): EIA Crude Oil Inventories, MBA Mortgage Applications Index
- Thursday (July 23): Continuing Claims, EIA Natural Gas Inventories, Initial Claims
- Friday (July 24): New Home Sales
Earnings:
- Monday (July 20): AGNC Investment Corp. (AGNC), Crown Holdings Inc. (CCK), Domino's Pizza Inc. (DPZ), Ryanair Holdings PLC (RYAAY), Steel Dynamics Inc. (STLD), W.R. Berkley Corp. (WRB), Zions Bankcorporation (ZION)
- Tuesday (July 21): Capital One Financial Corp. (COF), Chubb Limited (CB), Danaher Corp. (DHR), D.R. Horton Inc. (DHI), EQT Corp. (EQT), General Motors Co. (GM), Halliburton Co. (HAL), Interactive Brokers Group (IBKR), KeyCorp Inc. (KEY), Marsh & McLennan Companies Inc., 3M Co. (MMM), Northrop Grumman Corp. (NOC), Novartis AG (NVS)
- Wednesday (July 22): Alphabet Inc. (GOOGL), AT&T Inc. (T), CME Group Inc. (CME), CSX Corp. (CSX), Equinor ASA (EQNR), GE Vernova Inc. (GEV), Moody's Corp. (MCO), Philip Morris International Inc. (PM), ServiceNow Inc. (NOW), Tesla Inc. (TSLA), Texas Instruments Inc. (TXN), United Rentals Inc. (URI), Waste Connections Inc. (WCN)
- Thursday (July 23): Blackstone Inc. (BX), Comcast Corp. (CMCSA), Comfort Systems Inc. (FIX), Digital Realty Trust Inc. (DLR), Edwards Lifesciences Corp. (EW), Freeport-McMoRan Inc. (FCX), Hartford Insurance Group Inc. (HIG), Honeywell International Inc. (HON), Intel Corp. (INTC), Lockheed Martin Corp. (LMT), Newmont Corporation (NEM)Norfolk Southern Corp. (NSC), RTS Corp. (RTX), SAP SE (SAP), T-Mobile US Inc. (TMUS), Union Pacific Corp. (UNP)
- Friday (July 24): American Express Co. (AXP), Booz Allen Hamilton Holding Corp. (BAH), Canadian National Railway Co. (CNI), Charter Communications Inc. (CHTR), Nextera Energy Inc. (NEE), SLB Nv (SLB), Tenet Healthcare Corp. (THC), Verizon Communications Inc. (VZ)
Economic Data, Rates & the Fed
There was a heavy dose of economic data this week, which was highlighted by the monthly inflation reports (consumer price index, or CPI and producer price index, or PPI) and the monthly retail sales. On the inflation front, both reports came in cooler-than-expected, which resulted in a significant pullback in expectations around Federal Reserve rate hike probabilities. The problem is however that prices on WTI crude are up 14% this week due to a heavy exchange of attacks between the U.S. and Iran and subsequent drop off in traffic through the Strait of Hormuz. June Retail Sales slowed from May but there was continued evidence of resiliency in consumer spending. Elsewhere, regional business activity surprised to the upside as evidenced by the Philadelphia Fed and Empire State Manufacturing indexes. Here's a breakdown of the reports:
- Consumer Price Index (CPI): The headline CPI declined 0.4% in June, below the -0.1% expected and this translates into an annual inflation rate of +3.5%, below the 3.8% expected. Core CPI declined 0.2% in June (below the +0.2% expected), which translates into a +2.6% annual inflation rate (below the +2.8% estimate).
- Producer Price Index (PPI): The headline PPI declined 0.3% in June, which was below the 0.0% Dow Jones consensus estimate and the biggest decline since April 2025. On an annual basis, headline PPI increased 5.5%, down from 6.0% in May and below the +6.2% expected. Core PPI rose 0.2% in June, which was below the 0.4% expected. This puts the annual core PPI gain at 4.7%, well below the +5.2% expected.
- Retail Sales: Headline retail sales rose 0.2% in June following an upwardly revised 1.0% in May, which was just below economist expectations. This represented the smallest increase in five months. Core retail sales increased 0.5%.
- NFIB Small Business Optimism Index: Rose 2.1 points from the prior month to 97.4. The uptick in the NFIB survey is being attributed to small business expectations for better business conditions and higher real sales. 21% of respondents cited inflation as the biggest problem, which is the highest reading since October 2024.
- Empire State Manufacturing Index: Rose to 15.6 in July from 5.7 in the prior month and above the 8.5 expected. General Business Conditions increased 9.9 points to 15,6 while Employment (11.4) registered the highest reading since December 2022.
- Philadelphia Fed Index: The current general business activity diffusion index jumped to 41.4 from 10.3 in the prior month, which was well above the +13 expected. 53.1% of respondents reported and uptick in general business activity as new orders and shipments both contributed to the beat.
- Pending Home Sales: Dropped 5.4% in June, which was well below the 0.5% economists had forecast. Over the past 12 months the index is down 0.3%.
- Building Permits: 1.367M vs. 1.410M est.
- Housing Starts: 1.427M vs. 1.275M est.
- University of Michigan Consumer Sentiment – Preliminary: The overall index increased 10% to 54.4, which represents the highest level since February. Consumers felt some relief from falling gas prices, though consumer prices still increased 3.5% on an annual basis. Sentiment is still down 12% from a year ago.
- EIA Crude Oil Inventories: -1.69M barrels.
- EIA Natural Gas Inventories: +41 bcf.
- Initial Jobless Claims: Initial applications for U.S. jobless benefits decreased 8K from last week's (upwardly revised) 216K to 208K, which was below the 217K economists had expected. Continuing Claims dropped by 16K from the prior week to a seasonally adjusted 1.805M.
- The Atlanta Fed's GDPNow "nowcast" for Q2 GDP was revised up to 1.7% today from 1.3% last Friday.
U.S. Treasuries increased across the board this week, which was driven by the ceasefire cancellation and subsequent move higher in oil prices. Compared to last Friday, two-year Treasury yields moved down ~5 basis points (4.158% vs. 4.208%), 10-year yields eased a little over two basis points (4.545% vs. 4.569%) while 30-year yields (5.06% vs. 5.071%) is lower by ~1 basis points.
Market expectations around a potential rate hike from the Federal Reserve pulled back this week, primarily driven by the benign monthly inflation reports, and despite a 14% jump in oil prices. Per the Bloomberg rate probabilities, the probability of a rate hike at the July Federal Open Market Committee (FOMC) is now down to 10% from 33% and September FOMC has moved down to 60% from 86% (both week-over-week). The first theoretical 100% probability of a rate hike has moved back to the December FOMC meeting from October last week.
Technical Take
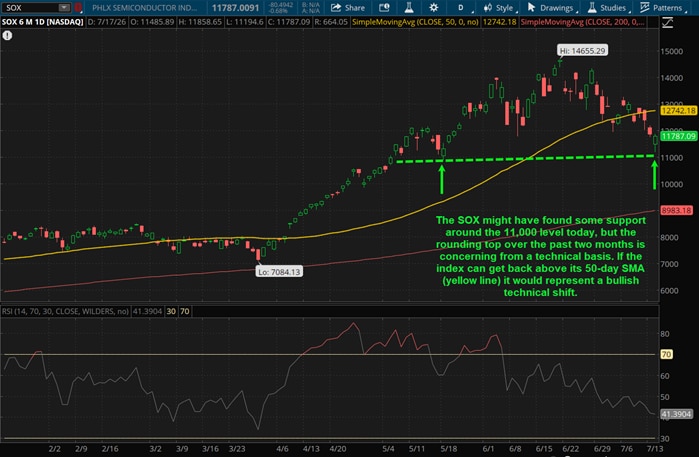
PHLX Semiconductor Index (SOX - 80 to 11,787)
Last week, I had a "slightly bullish" outlook on the PHLX Semiconductor Index (SOX), since it was above its 50-day SMA, but added that we would need a few more daily candles to make a technical determination. This week we got our answer and the translation is bearish as the index rolled over and lost that potential support at the 50-day SMA. Today, the index dropped near 11,000 (a level where it bounced back on May 19th) and turned back higher, so perhaps that can be viewed as near-term support. The SOX can still be considered near-term oversold, so perhaps there is some additional upside early next week, but the intermediate-term chart looks concerning in my view. Whether you want to label it a "rounding top" or "head and shoulders top" formation, this index has something to prove in the coming weeks if it is going to reclaim its former leadership status. I'd say the 50-day SMA is the line in the technical sand, so if the SOX can push higher towards this intermediate-term indicator next week, let's see how it reacts. From a fundamental standpoint, my guess is that CapEx guidance from the hyperscalers over the next two weeks will be a highly influential factor for this index, so expect volatility (either to the downside or upside) to persist.
Near-term technical translation: slightly bullish (potentially up to the 50-day SMA)
Intermediate-term technical translation: bearish
Source: ThinkorSwim trading platform
Past performance is no guarantee of future results.
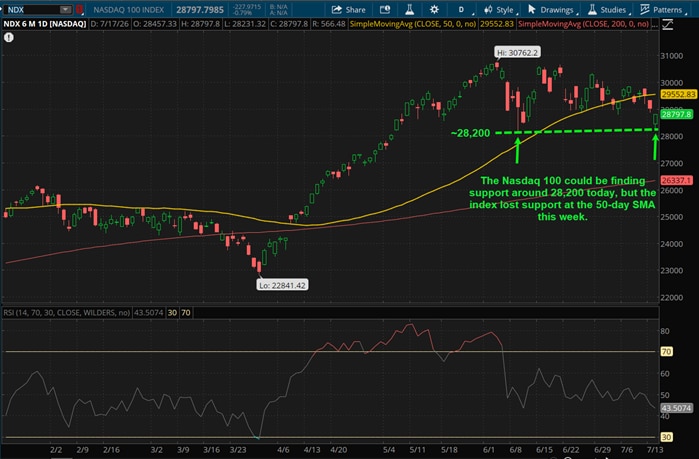
Nasdaq 100 Index (NDX - 228 to 28,797)
The Nasdaq 100 index (NDX) is home to many semiconductor stocks, so perhaps it's not a surprise that there are similarities in the charts, along with today's intraday reversal. The intraday low for the NDX back on June 9th was roughly 28,200, and this is the same level where buyers stepped in today, so maybe that can be considered near-term support. However, the index lost support at its 50-day SMA this week which is bearish technically. Like the SOX, the NDX could have some upside follow-through to the underside of its 50-day SMA next week, but that doesn't change the intermediate-term bearish technicals in my view.
Near-term technical translation: slightly bullish (potentially up to the 50-day SMA)
Intermediate-term technical translation: bearish
Source: ThinkorSwim trading platform
Past performance is no guarantee of future results.
Cryptocurrency News
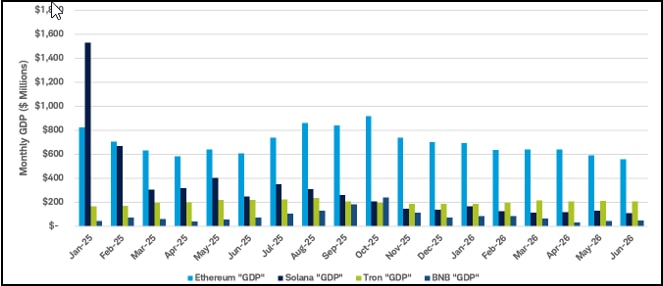
The Bitwise 10 Large Crypto Index is down 1% since last Friday, with bitcoin is down 1% and ether up 2% at the time of writing. This week, the CLARITY Act was in the news as the White House met with lawmakers to address ethics concerns, potentially paving the way for progress. As of this morning, it remains unclear whether the proposed changes have enough bipartisan support to clear the 60-vote cloture threshold. The clock is running out before the summer recess.
Most assets have performed in-line with bitcoin year to date when adjusted for beta
Source: Token Terminal, Schwab.
Jim Ferraioli , Director of Digital Currencies Research and Strategy, authored this report.
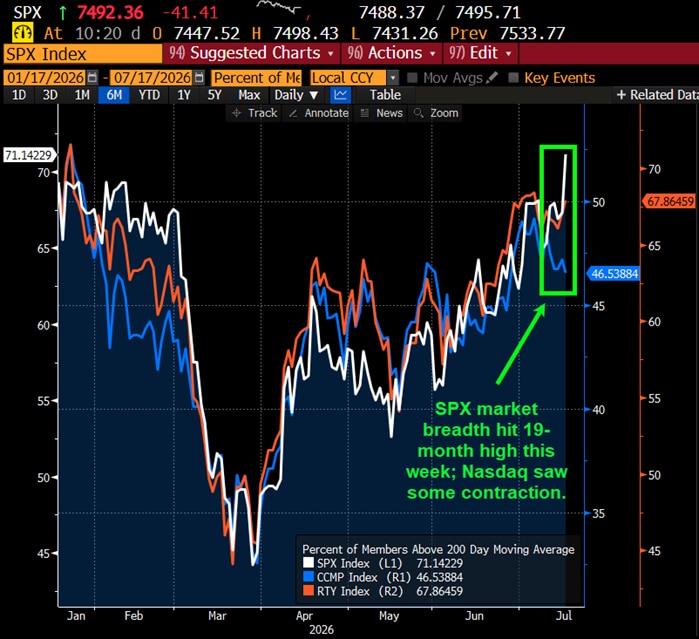
Market Breadth
The Bloomberg chart below shows the current percentage of members within the S&P 500 (SPX), Nasdaq Composite (CCMP), and Russell 2000 (RTY) that are trading above their respective 200-day Simple Moving Averages (SMA). In short, market breadth on the SPX (as measured by the percnetage of stocks above the 200-day SMA) is at the highest levels since December 2024, while market breadth on the Nasdaq contracted. Compared to last Friday, the SPX (white line) breadth moved up to 71.14% from 65.33%, the CCMP (blue line) fell to 46.53% vs. 48.45%, while the RUT (red line) is essentially flat at 67.86% versus 67.27% (all week-over-week).
Source: Bloomberg L.P.
Market breadth attempts to capture individual stock participation within an overall index, which can help convey underlying strength or weakness of a move or trend. Typically, broader participation suggests healthy investor sentiment and supportive technicals. There are many data points to help convey market breadth, such as advancing vs. declining issues, percentage of stocks within an index that are above or below a longer-term moving average, or new highs vs. new lows.
This Week's Notable 52-week Highs (109 today): Apple Inc. (AAPL - $0.70 to $332.56), Best Buy Company (BBY - $0.08 to $85.21), CVS Corp. (CVS + $0.62 to $107.12), JPMorgan Chase & Co. (JPM - $2.17 to $340.98), PBF Energy Inc. (PBF + $1.17 to $62.11), Valero Energy Corp. (VLO + $7.16 to $307.42)
This Week's Notable 52-week Lows (100 today): Boston Scientific Corp. (BSX + $0.13 to $44.75), Dolby Laboratories Inc. (DLB - $0.04 to $49.95), International Business Machines Inc. (IBM - $4.61 to $214.44), Las Vegas Sands Inc. (LVS + $0.04 to $45.74), Nano Nuclear Energy Inc. (NNE - $0.48 to $15.72), Pentair Ltd. (PNR - $1.05 to $64.64)