European Stocks: Reasons to Reconsider

Key takeaways
- Global growth has picked up and Europe's market is cyclically oriented, with 62% of the MSCI Europe Index in economically sensitive cyclical sectors as of August 31, 2026.
- A structural pivot to fiscal spending, led by Germany's potential approximately €1 trillion infrastructure and defense push, is a potential durable tailwind to growth and earnings.
- European earnings have rebounded and broadened: STOXX Europe 600 earnings grew 23.9% in the second quarter of 2026, and 2026-27 estimates are being revised higher according to Bloomberg data.
- Valuations are less demanding than the U.S., and Europe's total-yield edge is widening as artificial intelligence (AI) capital spending drains U.S. hyperscaler free cash flow.
- Europe may add diversification to a portfolio of U.S. equities, with a lower concentration in the top 10 companies in the MSCI Europe Index relative to the top 10 stocks in the S&P 500 index and a falling correlation to U.S. stocks.
We explore five reasons the outlook for European equities has improved and reiterate our view that investors should hold a globally diversified equity portfolio with a deliberate allocation to Europe.
Is this a call to shift from the U.S. market or a view that Europe will be the best-performing region from here? No, we're not forecasting a prolonged period of European equity outperformance and we note a number of headwinds. It is, however, an observation that the conditions that have historically heralded stronger periods of European equity performance have been gradually coming together. But we also recognize the risks, which could include slower global growth, a tightening of liquidity conditions, a stronger U.S. dollar, geopolitical tensions, energy-price shocks, and structural challenges within the eurozone.
1. Historically, global economic acceleration has tended to be bullish for European equities
Europe's stock market is cyclically oriented, with large weights in sectors that tend to move in tandem with economic growth. The cyclical Financials, Industrials, Consumer Discretionary, Energy, and Materials sectors combined account for about 62% of the MSCI Europe Index as of August 31, 2026, according to MSCI.
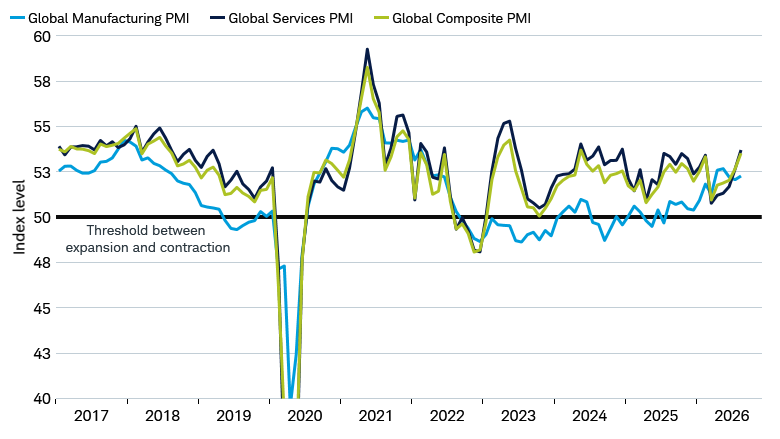
The global economy is in an expansion phase. The JPMorgan Global Composite Purchasing Managers' Index (PMI) measured it at 53.5 in August, its highest level since May 2023. Manufacturing and service sector PMIs have both increased from levels seen earlier in the year. Within the JPMorgan Global Manufacturing PMI report, new export orders rose for the first time in six months and jobs growth reached the highest level in over three years. Business optimism also rose for the third month in a row to the highest level since February.
Global growth at a 27-month high
Source: Schwab Center for Financial Research, S&P Global, and Macrobond.
Monthly data as of 9/8/2026. Values in 2020 are truncated for visualization purposes.
Indexes are unmanaged, do not incur management fees, costs, and expenses and cannot be invested in directly. Past performance is no guarantee of future results.
For illustrative purposes only.
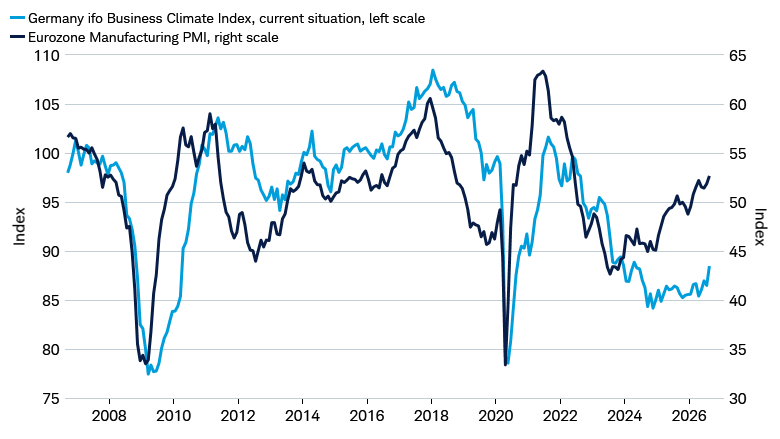
Europe's economy is also expanding, with economic data surprising to the upside over the last few months. This is despite Europe's vulnerability to the energy supply shock from the Iran war. The August S&P Global Eurozone Manufacturing PMI rose to 52.7, the highest level since May 2022, and new export orders expanded for just the second time in four-and-a-half years. In Germany, the current conditions component of the Germany ifo Business Climate Index rose 2.0 points to 88.5 in August, marking the highest level since April 2024.
European manufacturing improvement lifting business sentiment
Indexes are unmanaged, do not incur management fees, costs, and expenses and cannot be invested in directly.
Past performance is no guarantee of future results.
Why it matters now. European equities have greater cyclical bias due to their sector composition. Economic surveys in the form of PMIs from S&P Global suggest that growth is improving both globally and in Europe, which could produce stronger revenue growth for businesses.
2. The policy backdrop may support European equities
A structural pivot in fiscal spending in Germany, which has long been Europe's champion of fiscal austerity, could result in a €1 trillion multi-year infrastructure and defense package, alongside a broader European push toward "strategic autonomy." This policy shift might provide a durable tailwind for the overall market. The industrials, materials, construction, and defense industries have particular exposure to this policy shift, with the potential to create a virtuous cycle that might support business confidence, lift capacity utilization, and improve corporate profitability.
Germany's reform agenda includes tax relief, less red tape, more flexible labor-market rules, and pension reform. The European Union (EU) has advanced capital-market integration, regulatory simplification, and energy-policy reforms. While positive for equities, progress on these initiatives has been slow. Additional business- and capital-market-friendly reforms, less political fragmentation, and more responsive policy action could be beneficial for the market.
European banks are in a healthier position today after the lingering effects of the Global Financial Crisis and eurozone debt crisis. Deflation has given way to inflation and driven a steepening of the yield curve, which helps banks earn higher interest income on loans and other financial products. Banking sector balance sheets are also in a much healthier position versus the last 15 years.
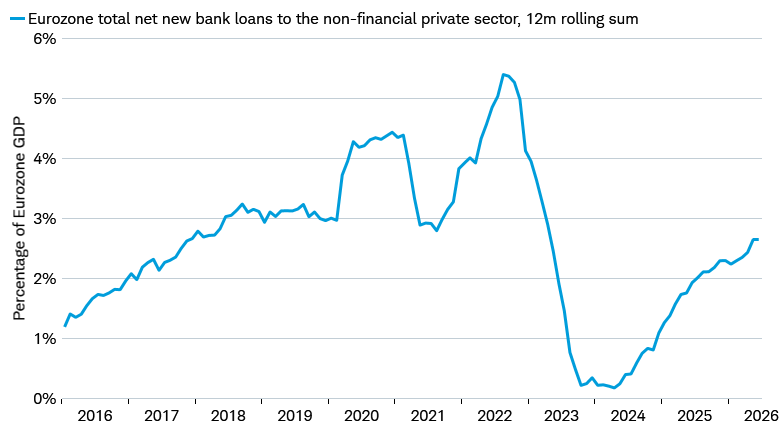
This is particularly important for Europe, where the business sector relies more heavily on bank lending than capital markets for raising money, unlike in the U.S. Eurozone net new bank loans to the non-financial private sector as a percentage of GDP have been accelerating the last two years (as seen in the chart below) and could continue to grow with increased public spending.
Credit is expanding in Europe, which can fund growth
Source: Schwab Center for Financial Research, European Central Bank, and Macrobond.
Monthly data as of 9/8/2026. Past performance is no guarantee of future results.
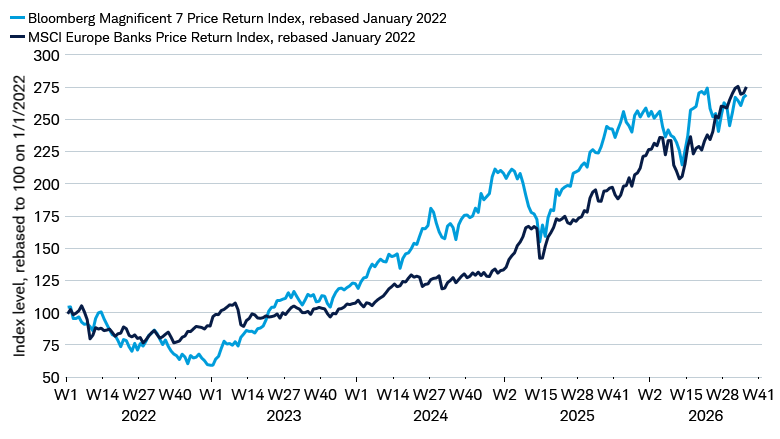
The health of Europe's banks is also vital for the performance of its stock market. Financials are 26% of the MSCI Europe Index, more than double the 12.2% in the MSCI USA Index as of August 31, 2026, according to MSCI. Historically, it has been rare to see European equities deliver strong returns without the banking sector participating. The good news is that the banks have been performing well. Indeed, they have kept pace with the Magnificent Seven (Mag 7) stocks over the last few years.
European banks have offered diversification from the Mag 7, with similar returns
Source: Schwab Center for Financial Research, Bloomberg, and Macrobond.
Weekly data as of 9/8/26.
Indexes are unmanaged, do not incur management fees, costs, and expenses and cannot be invested in directly. Past performance is no guarantee of future results.
Why it matters now: Fiscal expansion, not austerity, has historically accompanied periods of strong European equity performance. In our view, the current fiscal plan is unusually large and durable and European banks are in a healthy position to fund growth.
3. European earnings growth has rebounded and broadened
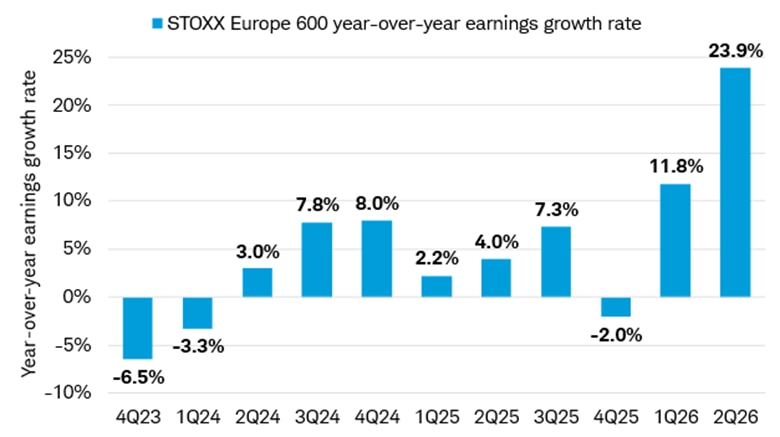
Earnings are the long-term engine of equity markets. Improving relative earnings growth has been a key metric for periods of strong European equity performance. By this measure, Europe has seen improvement with growth accelerating this year. The STOXX Europe 600 Index posted earnings growth of 11.8% in the first quarter and 23.9% in the second quarter—well above the single-digit or negative rate of growth of the prior two years.
The STOXX Europe 600 earnings are growing at double-digit rates
Source: Schwab Center for Financial Research and LSEG I/B/E/S, data as of 9/3/2026.
Indexes are unmanaged, do not incur management fees, costs, and expenses and cannot be invested in directly.
Past performance is no guarantee of future results.
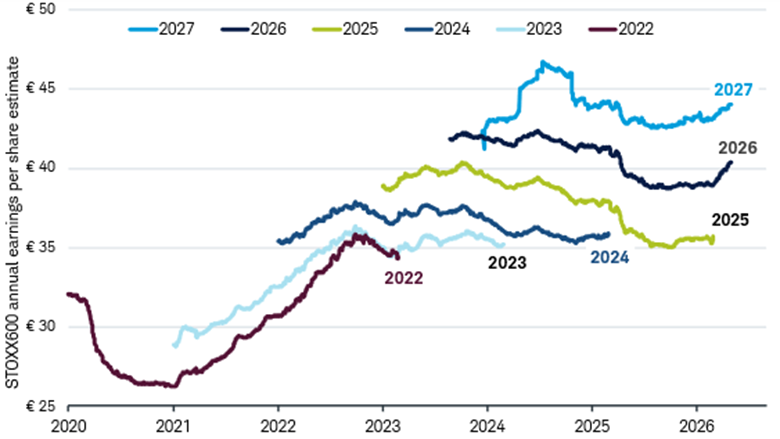
Looking forward, consensus earnings growth estimates are being revised higher for 2026 and 2027, and breadth has increased with more industries posting positive earnings growth. As of August 25, 2026, the consensus STOXX Europe 600 EPS growth estimate for 2026 has risen from 9.4% at the start of 2026 to 16.2%.
The progression of European earnings estimates for 2026 and 2027 has inflected upward
Source: Schwab Center for Financial Research and Bloomberg estimates.
Data as of 8/26/26.
Forecasts contained herein are for illustrative purposes only, may be based upon proprietary research and are developed through analysis of historical public data. Indexes are unmanaged, do not incur management fees, costs, and expenses and cannot be invested in directly. Past performance is no guarantee of future results.
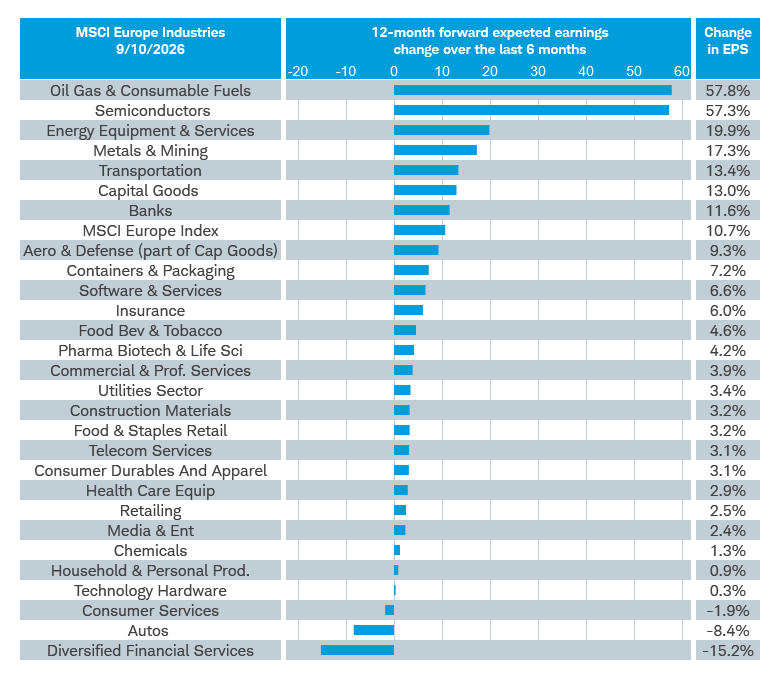
While Energy and Tech have seen the largest increase in earnings estimates, most sectors and industries have seen positive change.
Most industries have seen forward earnings estimates increase over the last 6 months
Source: Schwab Center for Financial Research, MSCI, Bloomberg, and Macrobond.
Data as of 9/5/2026. Forecasts contained herein are for illustrative purposes only, may be based upon proprietary research and are developed through analysis of historical public data.
Past performance is no guarantee of future results.
Why it matters now: European earnings growth has accelerated and broadened across industries. Consensus earnings estimates for both 2026 and 2027 are increasing.
4. Valuations in Europe are less demanding than in the U.S.
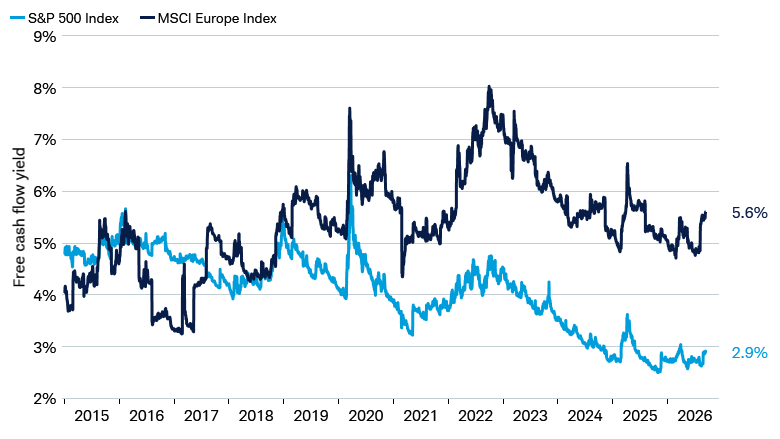
European equities trade at lower valuations and offer higher free cash flow yields than U.S. equities. Europe trades at 14.7 times next 12-month earnings and has a 5.5% free cash flow yield, compared with 19.6 times earnings and a 2.9% free cash flow yield for the United States, according to MSCI data. Is Europe cheap? No, few equity markets are cheap today, but current valuations don't appear to be a major risk to returns today and they may have room for expansion should the growth story hold up and investor sentiment improve.
AI capex reducing U.S. free cash flow, while Europe can return cash (through stock buybacks or dividends) to shareholders
Source: Schwab Center for Financial Research, Bloomberg, S&P Global, MSCI, and Macrobond, as of 9/9/2026.
Indexes are unmanaged, do not incur management fees, costs, and expenses and cannot be invested in directly. Past performance is no guarantee of future results.
Europe is not cheap on price to trailing 10-year earnings, but it's much less expensive than the U.S.
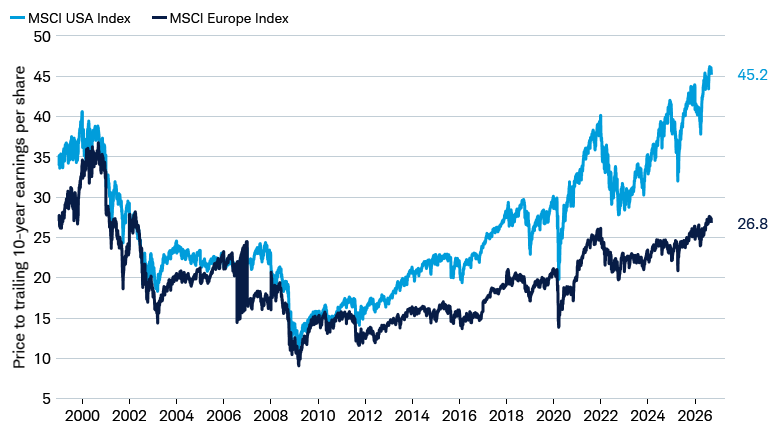
Source: Schwab Center for Financial Research, Bloomberg, S&P Global, MSCI, and Macrobond, as of 9/10/2026.
Indexes are unmanaged, do not incur management fees, costs, and expenses and cannot be invested in directly. Past performance is no guarantee of future results.
Europe also appears more attractive because of the combination of dividend yield and stock buyback yield (together referred to as total yield). And here, the U.S. sported higher total yield for all but a couple months from 2010-2022, due mostly to larger stock buybacks. But with the strong performance of U.S. equities, dividend yields have compressed in the U.S. Moreover, the AI capex boom is consuming much of the free cash flow generation of U.S. companies, leaving less cash available to repurchase stock or increase dividends.
Europe's total yield advantage to the U.S. has widened
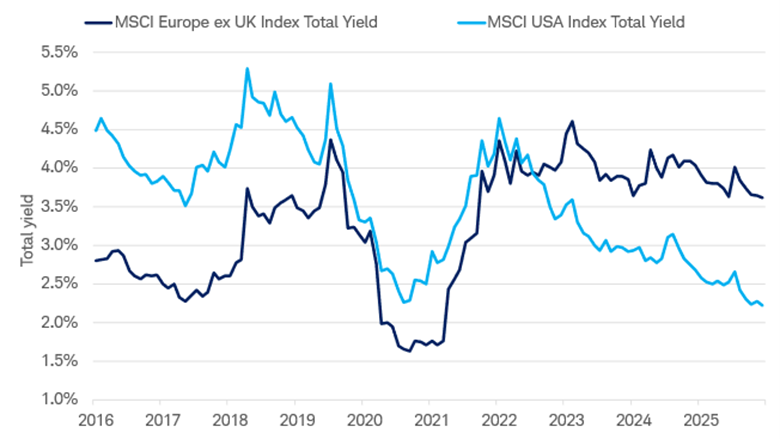
Source: Schwab Center for Financial Research and FactSet.
Monthly data as of 9/1/2026. Total yield is defined as dividend yield plus share buyback yield. Past performance is no guarantee of future results.
Why it matters now: Global equity valuations are above average across most major regions and large differentials have built up over recent years, driven in part by relative exposures to technology winners and investor perception about future growth. Europe's relative valuation discount is likely taking these dynamics into account, leaving room for a favorable convergence should conditions continue to improve.
5. Europe provides diversification from the AI trade and more concentrated U.S. and emerging markets
Beyond valuation, Europe may offer a strong diversification option relative to today's extremely concentrated U.S. market. Europe has a broader sector mix and is much less concentrated among the top names. The largest 10 stocks in MSCI Europe make up 21% of the total index versus nearly 40% of the S&P 500. This means Europe may offer lower single-stock and sector concentration.
Europe is less top-heavy vs. the U.S., with a smaller market weight in the largest stocks
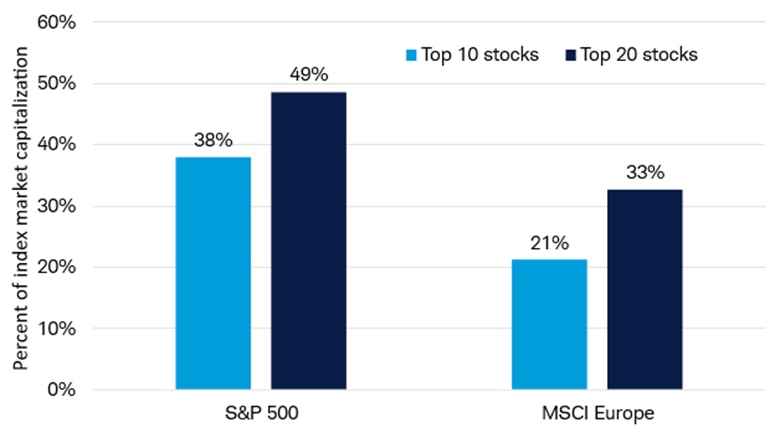
Source: Schwab Center for Financial Research and Bloomberg.
Data as of 9/8/2026.
Indexes are unmanaged, do not incur management fees, costs, and expenses and cannot be invested in directly.
Past performance is no guarantee of future results.
And today, the MSCI Europe Index's correlation to the S&P 500 is close to 0.60, which is well below the historical average. As we explained above, correlation is a statistical measure of how two investments have historically moved in relation to each other, and ranges from -1 to +1. A correlation of +1 indicates a perfect positive correlation, while a correlation of -1 indicates a perfect negative correlation. A correlation of zero means the assets are not correlated.
As tech dominates U.S. markets, the S&P 500's correlation with Europe has declined
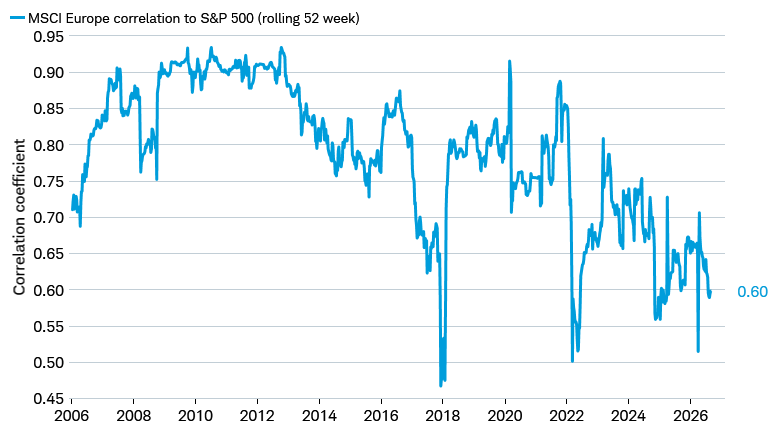
Source: Schwab Center for Financial Research and Macrobond.
Weekly data as of 9/9/26.
Correlation is a statistical measure of how two investments have historically moved in relation to each other, and ranges from -1 to +1. A correlation of +1 indicates a perfect positive correlation, while a correlation of -1 indicates a perfect negative correlation. A correlation of zero means the assets are not correlated.
Indexes are unmanaged, do not incur management fees, costs, and expenses and cannot be invested in directly. Past performance is no guarantee of future results.
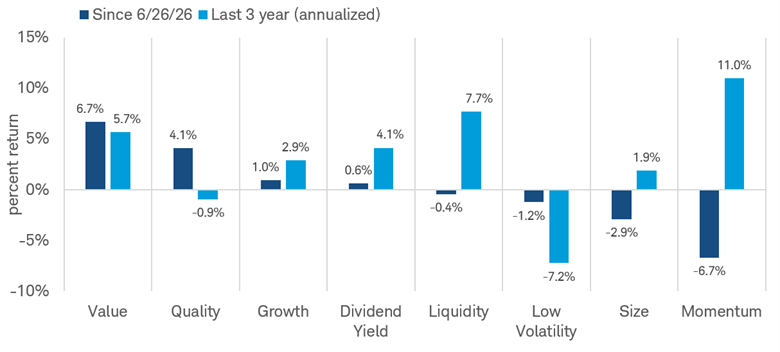
Diversification can help protect portfolios during periods when market leadership shifts from one driver to another. One way to consider this is via equity factor analysis, where market leadership has changed over the last couple of months. The prolonged outperformance of large-cap technology stocks helped Momentum-factor-oriented investments outperform other factors, including Value. In July, however, leadership shifted, with Value outperforming Momentum.
Recent S&P 500 performance has shifted from Momentum factor leadership to Value factor leadership
Source: Schwab Center for Financial Research and Bloomberg, as of 9/10/2026.
Equity factors are characteristics that may help explain differences in stock performance. Value refers to stocks that appear inexpensive relative to fundamentals such as earnings, sales, cash flow, or book value. Quality refers to companies with stronger financial characteristics, such as solid balance sheets, stable earnings, or high profitability. Growth refers to companies expected to grow earnings or revenue faster than the broader market. Dividend Yield refers to stocks that pay relatively high dividends compared with their share price. Liquidity refers to stocks that tend to be easier to buy or sell because they trade frequently and in large volumes. Low Volatility refers to stocks that have historically had smaller price swings than the broader market. Size refers to stocks grouped by market capitalization. Momentum refers to stocks that have recently performed well relative to the broader market.
Indexes are unmanaged, do not incur management fees, costs, and expenses and cannot be invested in directly. Past performance is no guarantee of future results.
Why it matters now: Europe's relatively low index concentration means it is less dependent on a small group of stocks or any one particular theme. Adding European equities to portfolios might also increase diversification from a sector perspective and because its correlation to the S&P 500 is on the low end of its historic range.
What about the risks?
We believe globally diversified equity portfolios offer better potential for risk-adjusted returns than any single market for long-term investors, even though individual markets may have prolonged periods of outperformance and underperformance. Indeed, those periodic shifts in leadership are a feature—not a bug—of global investing.
None of the above argues for abandoning any one region in favor of Europe. While we see Europe as a genuine diversifier with stronger fundamentals, there are risks. We see four potential areas of risk for Europe over the next year or two:
- The global economic cycle may slow or become more desynchronized, which could see Europe's earnings recovery stall.
- Global liquidity conditions could tighten and/or the U.S. dollar could strengthen. Easy global policy conditions and a weaker U.S. dollar have been consistent features in periods of strong European performance. Easy global policy conditions can make it easier for banks to lend, supporting business investment and consumer spending. A weaker U.S. dollar typically coincides with capital rotating toward international markets. In the near term, we believe the European Central Bank and the U.S. Federal Reserve could both be hiking rates, which could keep the U.S. dollar somewhat stable relative to the euro. The lack of dollar strength would be positive for European equities.
- Energy vulnerability could reemerge. The spike in energy prices this year has been offset by reserve drawdowns and strong energy sector earnings. But the longer energy supplies are disrupted due to geopolitical conflicts in Iran, Ukraine, and Russia, the greater the risk that Europe could face higher inflation and/or weaker growth. Natural gas inventories are below average heading into the fall and winter, and prices are still elevated.
- Structural imbalances within the eurozone may drag on growth. The International Monetary Fund (IMF) cites weak productivity growth, made worse by rapid aging and a shrinking workforce, along with elevated public debt in some countries.
The bottom line
The argument for adding exposure is not conviction that Europe will beat the U.S. every year; it's a view that globally diversified portfolios can offer strong risk-adjusted returns over the long term and help offset periods of volatility in other regions. We also recognize an improvement in the conditions that have historically accompanied European outperformance: global economic acceleration, fiscal expansion, recovering earnings, undemanding valuations, and the potential for a stable dollar.
Heather O'Leary, Senior Manager, Equity Research and Strategy, contributed to this report.