Trading Tools
Learn about specialized tools traders may use to make trading decisions.

How to Navigate OTC Trading
Be sure you understand the risks of over-the-counter trading before you jump in.

7 Basic thinkorswim® desktop Chart Drawing Tools
Understanding how to use thinkorswim® desktop's drawing tools can help traders identify trends and patterns. Here's an overview of seven commonly used chart drawing tools.

How to See Your Investment Income on Schwab.com
To see a holistic view of investment income, including dividends, consider using the Investment Income tool on Schwab.com.

Mastering the Order Types: Market Orders
Learn about the characteristics, risks, and advantages of market orders.
High-Frequency Algorithmic Trading
Frequently asked questions about high-frequency trading (HFT) and how this technology impacts investors.
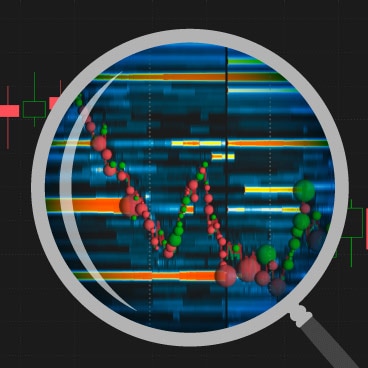
Using Bookmap on thinkorswim®
Bookmap is a charting application available on thinkorswim that offers visual insight into real-time market data. Traders can use it to better visualize supply, demand, and volume.

3 Strength Indicators for Assessing Stock Momentum
Deciding if a trend is forming—and how strong it might be—can make or break a trade. Here are three strength indicators technical traders use to assess a stock's momentum.
Charting Seasonality in thinkorswim® desktop
Identifying market or stock patterns can help inform trades. Here's how traders create seasonality charts with thinkorswim® desktop.
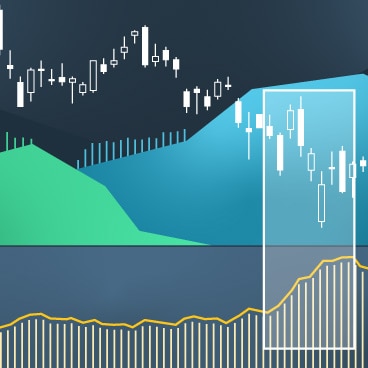
The Average True Range Indicator and Volatility
The Average True Range indicator can help traders analyze volatility, place stops and limits, and manage position size.
