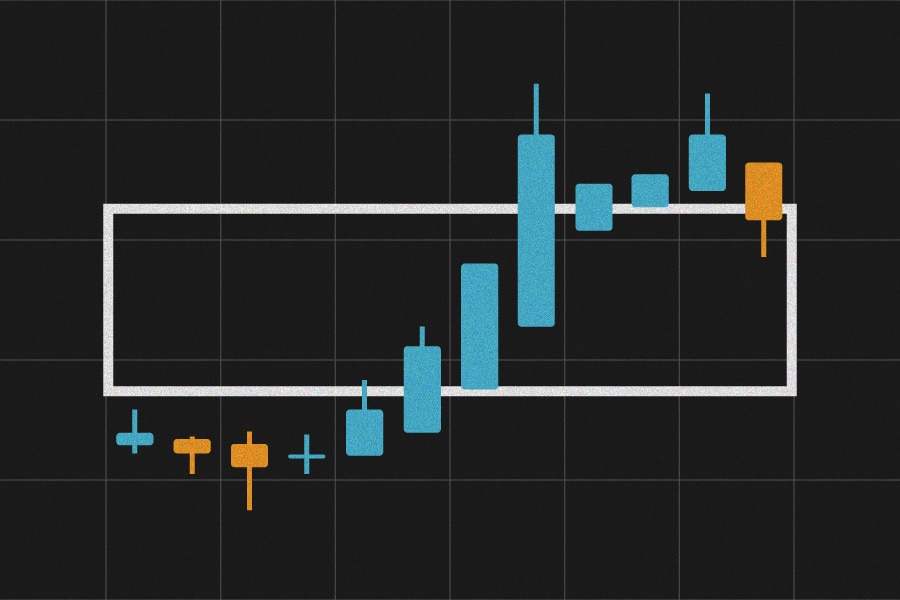
How to Use Heikin Ashi Charts

More Than Meets the Eye: How to Read Stock Quotes

How to Tell If a Market Is Overbought or Oversold

Breaking Bad Trade Behaviors

Using Implied Volatility Percentiles

7 Basic thinkorswim® desktop Chart Drawing Tools

Breadth Check: Strength and Weakness Trend Tracker

Filtering the Market Using Technical Analysis

Using Bookmap on thinkorswim®

3 Strength Indicators for Assessing Stock Momentum
The information provided here is for general informational purposes only and is not intended to be a substitute for specific individualized tax, legal or investment planning advice. Where specific advice is necessary or appropriate, consult with a qualified tax advisor, CPA, financial planner or investment manager.
Investing involves risk, including loss of principal. Hedging and protective strategies generally involve additional costs and do not assure a profit or guarantee against loss.
Options carry a high level of risk and are not suitable for all investors. Certain requirements must be met to trade options through Schwab. Please read the options disclosure document titled "Characteristics and Risks of Standardized Options" before considering any option transaction. Supporting documentation for any claims or statistical information is available upon request.
With long options, investors may lose 100% of funds invested.
Covered calls provide downside protection only to the extent of premiums received, and prevent any profitability above the strike price of the call.
Cryptocurrency- related products carry a substantial level of risk and are not suitable for all investors. Investments in cryptocurrencies are relatively new, highly speculative, and may be subject to extreme price volatility, illiquidity, and increased risk of loss, including your entire investment in the fund. Spot markets on which cryptocurrencies trade are relatively new and largely unregulated, and therefore, may be more exposed to fraud and security breaches than established, regulated exchanges for other financial assets or instruments. Some cryptocurrency-related products use futures contracts to attempt to duplicate the performance of an investment in cryptocurrency, which may result in unpredictable pricing, higher transaction costs, and performance that fails to track the price of the reference cryptocurrency as intended. Please read more about risks of trading cryptocurrency futures here.
Futures, futures options and Forex trading involves substantial risk and is not suitable for all investors. Please read the Risk Disclosure Statement for Futures and Options prior to trading futures products.
Forex trading involves leverage, carries a substantial level of risk, and is not suitable for all investors. Please read the Risk Disclosure for Forex.
0924-RGR0